AROMEThe selected variable and region is available, but not for 2025-07-07, 09:00. You will switch back to the first available time step. AROME is a high resolution (2.5 km) weather forecast model which is used by various weather services in Europe. On the WZ, forecasts from Meteo France and the Norwegian Weather Service are shown for western Europe and northern Europe, respectively.
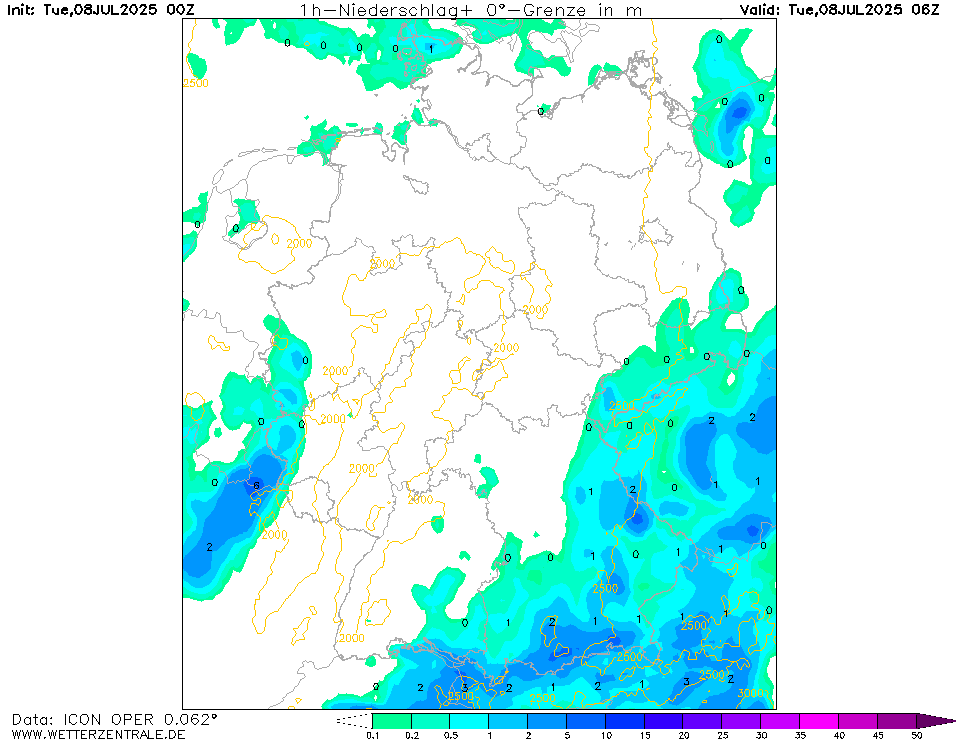
ICONCurrently selected. ICON is the global weather forecast of the German weather service (DWD) with a grid spacing of approx. 13 km globally (Europe nest: 6 km). Model output is available up to 180 hours ahead for the 0Z and 12Z runs, and up to 120 hours for the 6Z and 18Z runs.
WRFThe selected variable and region is available, but not for 2025-07-07, 09:00. You will switch back to the first available time step. WRF (Weather Research and Forecasting model) is a freely available weather forecast model. WRF version 3.9 is run on the WZ servers and offers 4 forecasts per day up to 72 hours. It is currently run with a horizontal grid spacing of 5 km and uses the WRF single-moment 3 class microphysics scheme, the YSU PBL scheme and the Dudhia radiation scheme.


1Mon 07 Jul 04:00
2Mon 07 Jul 05:00
3Mon 07 Jul 06:00
4Mon 07 Jul 07:00
5Mon 07 Jul 08:00
6Mon 07 Jul 09:00
7Mon 07 Jul 10:00
8Mon 07 Jul 11:00
9Mon 07 Jul 12:00
10Mon 07 Jul 13:00
11Mon 07 Jul 14:00
12Mon 07 Jul 15:00
13Mon 07 Jul 16:00
14Mon 07 Jul 17:00
15Mon 07 Jul 18:00
16Mon 07 Jul 19:00
17Mon 07 Jul 20:00
18Mon 07 Jul 21:00
19Mon 07 Jul 22:00
20Mon 07 Jul 23:00
21Tue 08 Jul 00:00
22Tue 08 Jul 01:00
23Tue 08 Jul 02:00
24Tue 08 Jul 03:00
25Tue 08 Jul 04:00
26Tue 08 Jul 05:00
27Tue 08 Jul 06:00
28Tue 08 Jul 07:00
29Tue 08 Jul 08:00
30Tue 08 Jul 09:00
31Tue 08 Jul 10:00
32Tue 08 Jul 11:00
33Tue 08 Jul 12:00
34Tue 08 Jul 13:00
35Tue 08 Jul 14:00
36Tue 08 Jul 15:00
37Tue 08 Jul 16:00
38Tue 08 Jul 17:00
39Tue 08 Jul 18:00
40Tue 08 Jul 19:00
41Tue 08 Jul 20:00
42Tue 08 Jul 21:00
43Tue 08 Jul 22:00
44Tue 08 Jul 23:00
45Wed 09 Jul 00:00
46Wed 09 Jul 01:00
47Wed 09 Jul 02:00
48Wed 09 Jul 03:00
49Wed 09 Jul 04:00
50Wed 09 Jul 05:00
51Wed 09 Jul 06:00
52Wed 09 Jul 07:00
53Wed 09 Jul 08:00
54Wed 09 Jul 09:00
55Wed 09 Jul 10:00
56Wed 09 Jul 11:00
57Wed 09 Jul 12:00
58Wed 09 Jul 13:00
59Wed 09 Jul 14:00
60Wed 09 Jul 15:00
61Wed 09 Jul 16:00
62Wed 09 Jul 17:00
63Wed 09 Jul 18:00
64Wed 09 Jul 19:00
65Wed 09 Jul 20:00
66Wed 09 Jul 21:00
67Wed 09 Jul 22:00
68Wed 09 Jul 23:00
69Thu 10 Jul 00:00
70Thu 10 Jul 01:00
71Thu 10 Jul 02:00
72Thu 10 Jul 03:00
73Thu 10 Jul 04:00
74Thu 10 Jul 05:00
75Thu 10 Jul 06:00
76Thu 10 Jul 07:00
77Thu 10 Jul 08:00
78Thu 10 Jul 09:00
81Thu 10 Jul 12:00
84Thu 10 Jul 15:00
87Thu 10 Jul 18:00
90Thu 10 Jul 21:00
93Fri 11 Jul 00:00
96Fri 11 Jul 03:00
99Fri 11 Jul 06:00
102Fri 11 Jul 09:00
105Fri 11 Jul 12:00
108Fri 11 Jul 15:00
111Fri 11 Jul 18:00
114Fri 11 Jul 21:00
117Sat 12 Jul 00:00
120Sat 12 Jul 03:00
123Sat 12 Jul 06:00
126Sat 12 Jul 09:00
129Sat 12 Jul 12:00
132Sat 12 Jul 15:00
135Sat 12 Jul 18:00
138Sat 12 Jul 21:00
141Sun 13 Jul 00:00
144Sun 13 Jul 03:00
147Sun 13 Jul 06:00
150Sun 13 Jul 09:00
153Sun 13 Jul 12:00
156Sun 13 Jul 15:00
159Sun 13 Jul 18:00
162Sun 13 Jul 21:00
165Mon 14 Jul 00:00
168Mon 14 Jul 03:00
171Mon 14 Jul 06:00
174Mon 14 Jul 09:00
177Mon 14 Jul 12:00
180Mon 14 Jul 15:00
help
Download GIF
click
Single-variable mode
You are now in the multi variable mode. Select all the variables of interest and they will be plotted side-by-side in a grid.
You are now in the multi variable mode. Select all the variables of interest and they will be plotted side-by-side in a grid.
URL of this map