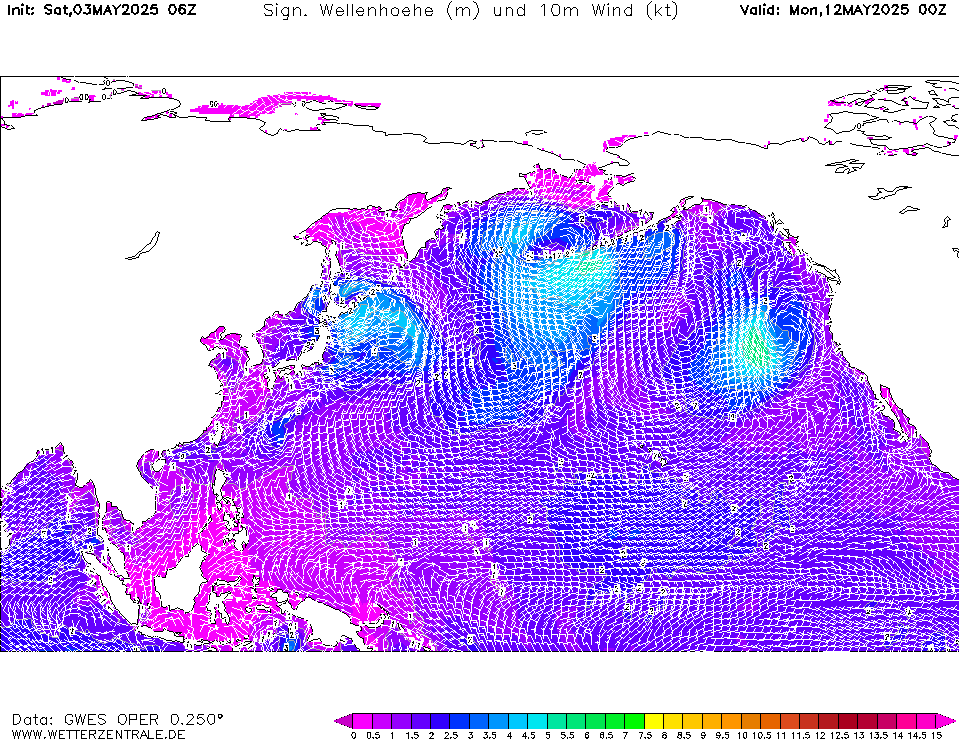
GWESCurrently selected. This page shows the wave model output from NCEP's Global Forecast System GFS (FV3). It was formerly known as GWES. The model is coupled with the GFS atmospheric model and is run 4 times daily based on 0000, 0600, 1200, and 1800 UTC start time and provides predictions to 384 hours.

Member:
OP 0Sat 05 Jul 06:00
1Sat 05 Jul 07:00
2Sat 05 Jul 08:00
3Sat 05 Jul 09:00
4Sat 05 Jul 10:00
5Sat 05 Jul 11:00
6Sat 05 Jul 12:00
7Sat 05 Jul 13:00
8Sat 05 Jul 14:00
9Sat 05 Jul 15:00
10Sat 05 Jul 16:00
11Sat 05 Jul 17:00
12Sat 05 Jul 18:00
13Sat 05 Jul 19:00
14Sat 05 Jul 20:00
15Sat 05 Jul 21:00
16Sat 05 Jul 22:00
17Sat 05 Jul 23:00
18Sun 06 Jul 00:00
19Sun 06 Jul 01:00
20Sun 06 Jul 02:00
21Sun 06 Jul 03:00
22Sun 06 Jul 04:00
23Sun 06 Jul 05:00
24Sun 06 Jul 06:00
25Sun 06 Jul 07:00
26Sun 06 Jul 08:00
27Sun 06 Jul 09:00
28Sun 06 Jul 10:00
29Sun 06 Jul 11:00
30Sun 06 Jul 12:00
31Sun 06 Jul 13:00
32Sun 06 Jul 14:00
33Sun 06 Jul 15:00
34Sun 06 Jul 16:00
35Sun 06 Jul 17:00
36Sun 06 Jul 18:00
37Sun 06 Jul 19:00
38Sun 06 Jul 20:00
39Sun 06 Jul 21:00
40Sun 06 Jul 22:00
41Sun 06 Jul 23:00
42Mon 07 Jul 00:00
43Mon 07 Jul 01:00
44Mon 07 Jul 02:00
45Mon 07 Jul 03:00
46Mon 07 Jul 04:00
47Mon 07 Jul 05:00
48Mon 07 Jul 06:00
49Mon 07 Jul 07:00
50Mon 07 Jul 08:00
51Mon 07 Jul 09:00
52Mon 07 Jul 10:00
53Mon 07 Jul 11:00
54Mon 07 Jul 12:00
55Mon 07 Jul 13:00
56Mon 07 Jul 14:00
57Mon 07 Jul 15:00
58Mon 07 Jul 16:00
59Mon 07 Jul 17:00
60Mon 07 Jul 18:00
61Mon 07 Jul 19:00
62Mon 07 Jul 20:00
63Mon 07 Jul 21:00
64Mon 07 Jul 22:00
65Mon 07 Jul 23:00
66Tue 08 Jul 00:00
67Tue 08 Jul 01:00
68Tue 08 Jul 02:00
69Tue 08 Jul 03:00
70Tue 08 Jul 04:00
71Tue 08 Jul 05:00
72Tue 08 Jul 06:00
73Tue 08 Jul 07:00
74Tue 08 Jul 08:00
75Tue 08 Jul 09:00
76Tue 08 Jul 10:00
77Tue 08 Jul 11:00
78Tue 08 Jul 12:00
79Tue 08 Jul 13:00
80Tue 08 Jul 14:00
81Tue 08 Jul 15:00
82Tue 08 Jul 16:00
83Tue 08 Jul 17:00
84Tue 08 Jul 18:00
85Tue 08 Jul 19:00
86Tue 08 Jul 20:00
87Tue 08 Jul 21:00
88Tue 08 Jul 22:00
89Tue 08 Jul 23:00
90Wed 09 Jul 00:00
91Wed 09 Jul 01:00
92Wed 09 Jul 02:00
93Wed 09 Jul 03:00
94Wed 09 Jul 04:00
95Wed 09 Jul 05:00
96Wed 09 Jul 06:00
97Wed 09 Jul 07:00
98Wed 09 Jul 08:00
99Wed 09 Jul 09:00
100Wed 09 Jul 10:00
101Wed 09 Jul 11:00
102Wed 09 Jul 12:00
103Wed 09 Jul 13:00
104Wed 09 Jul 14:00
105Wed 09 Jul 15:00
106Wed 09 Jul 16:00
107Wed 09 Jul 17:00
108Wed 09 Jul 18:00
109Wed 09 Jul 19:00
110Wed 09 Jul 20:00
111Wed 09 Jul 21:00
112Wed 09 Jul 22:00
113Wed 09 Jul 23:00
114Thu 10 Jul 00:00
115Thu 10 Jul 01:00
116Thu 10 Jul 02:00
117Thu 10 Jul 03:00
118Thu 10 Jul 04:00
119Thu 10 Jul 05:00
120Thu 10 Jul 06:00
123Thu 10 Jul 09:00
126Thu 10 Jul 12:00
129Thu 10 Jul 15:00
132Thu 10 Jul 18:00
135Thu 10 Jul 21:00
138Fri 11 Jul 00:00
141Fri 11 Jul 03:00
144Fri 11 Jul 06:00
147Fri 11 Jul 09:00
150Fri 11 Jul 12:00
153Fri 11 Jul 15:00
156Fri 11 Jul 18:00
159Fri 11 Jul 21:00
162Sat 12 Jul 00:00
165Sat 12 Jul 03:00
168Sat 12 Jul 06:00
171Sat 12 Jul 09:00
174Sat 12 Jul 12:00
177Sat 12 Jul 15:00
180Sat 12 Jul 18:00
183Sat 12 Jul 21:00
186Sun 13 Jul 00:00
189Sun 13 Jul 03:00
192Sun 13 Jul 06:00
195Sun 13 Jul 09:00
198Sun 13 Jul 12:00
201Sun 13 Jul 15:00
204Sun 13 Jul 18:00
207Sun 13 Jul 21:00
210Mon 14 Jul 00:00
213Mon 14 Jul 03:00
216Mon 14 Jul 06:00
219Mon 14 Jul 09:00
222Mon 14 Jul 12:00
225Mon 14 Jul 15:00
228Mon 14 Jul 18:00
231Mon 14 Jul 21:00
234Tue 15 Jul 00:00
237Tue 15 Jul 03:00
240Tue 15 Jul 06:00
help
Download GIF
click
Single-variable mode
You are now in the multi variable mode. Select all the variables of interest and they will be plotted side-by-side in a grid.
You are now in the multi variable mode. Select all the variables of interest and they will be plotted side-by-side in a grid.
URL of this map