AIFSThe selected variable and region is available, but not for 2025-07-04, 18:00. You will switch back to the first available time step. ECMWF runs the Artificial Intelligence/Integrated Forecasting System (AIFS). The output of this AIFS experimental model is forecast with 6-hourly time steps out to 15 days initialised from the ECMWF operational analysis. Forecasts are produced four times per day (00/06/12/18UTC). The data are released 1 hour after the real-time. See more info here.
ARPEGEThe selected variable and region is available, but not for 2025-07-04, 18:00. You will switch back to the first available time step. ARPEGE is the global forecast model of the French weather service (Meteo France). It is runs with a maximum resolution of approx. 7 km in Europe and mean global grid spacing of 15 km. WZ offers forecasts up to 102 hours.
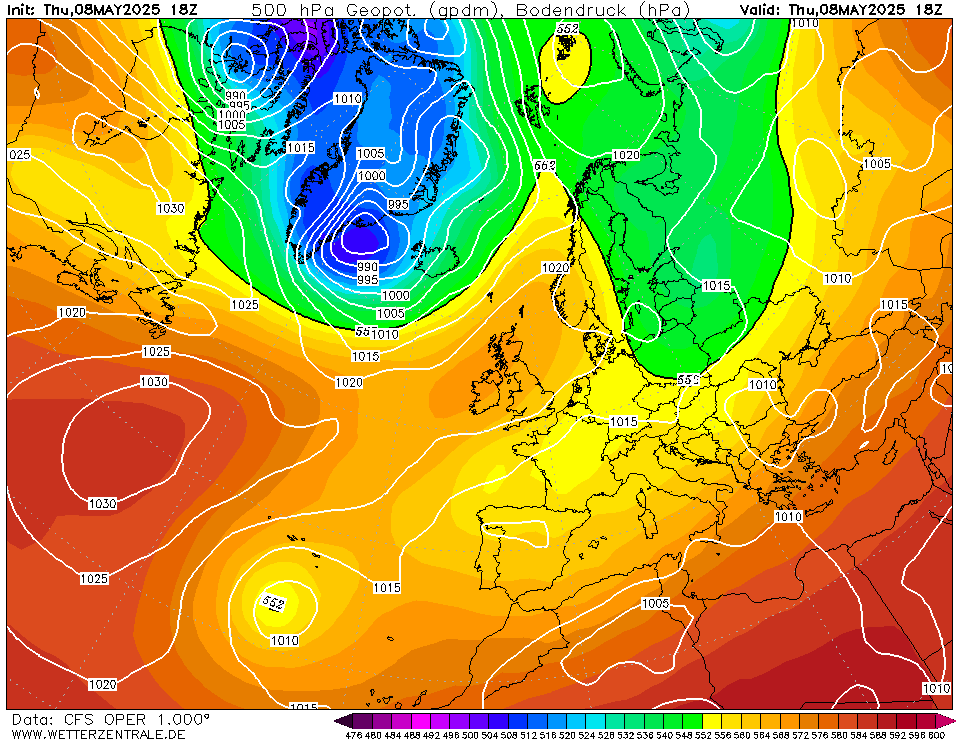
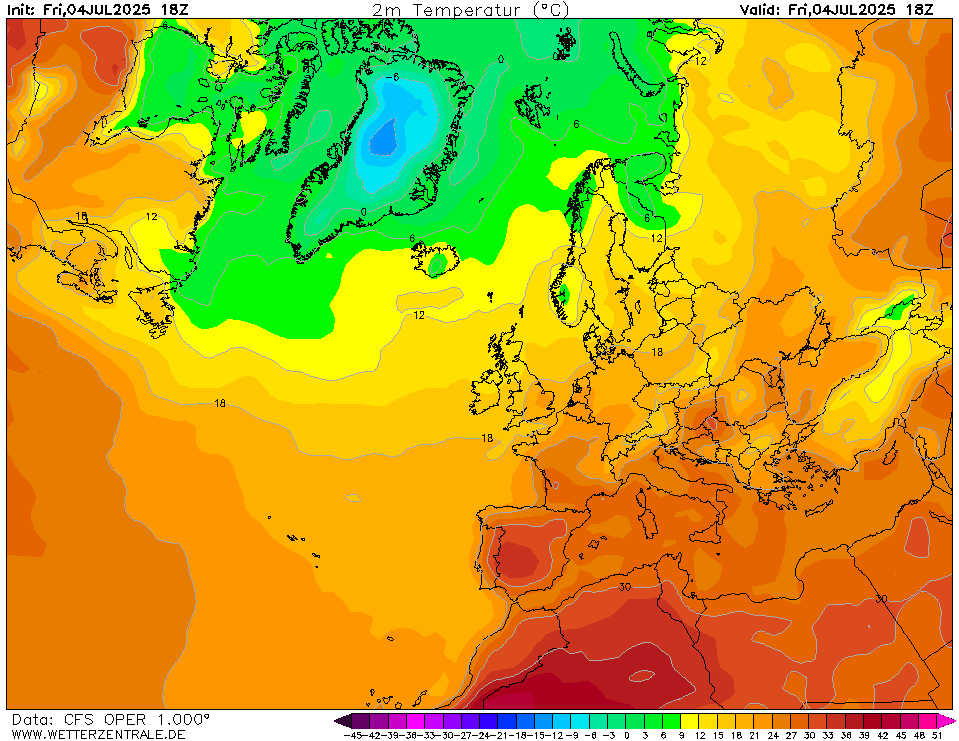
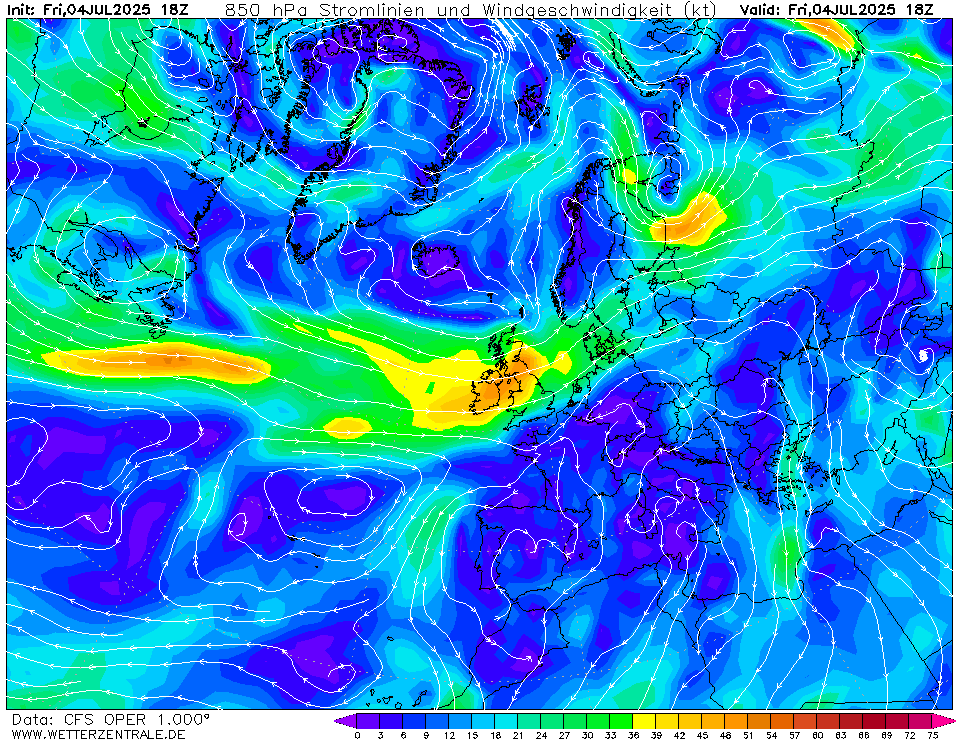
CFSCurrently selected.
ECMWFThe selected variable and region is available, but not for 2025-07-04, 18:00. You will switch back to the first available time step. The European Centre for Medium-Range Weather Forecasts (ECMWF) creates forecasts for the upcoming 15 days and is a global leader in forecast skill. However, it offers only a small number of parameters for free. The 00Z and 12Z runs are coming in twice daily between 6 and 7 UTC and 18 and 19 UTC.
GEMThe selected variable and region is available, but not for 2025-07-04, 18:00. You will switch back to the first available time step. GEM is the global forecast model of the Canadian weather service and computes 10 day forecasts.
GFSThe selected variable and region is available, but not for 2025-07-04, 18:00. You will switch back to the first available time step. GFS is the global weather forecast model of the US weather service run at an internal resolution of 28 km. It offers a plethora of parameters for the next 15 days. Updated 4 times a day up to 384 hours ahead. The runs for the 0, 6, 12 and 18Z runs are usually coming in from 3:30, 9:30, 15:30 and 21:30 UTC, respectively.
ICONThe selected variable and region is available, but not for 2025-07-04, 18:00. You will switch back to the first available time step. ICON is the global weather forecast of the German weather service (DWD) with a grid spacing of approx. 13 km globally (Europe nest: 6 km). Model output is available up to 180 hours ahead for the 0Z and 12Z runs, and up to 120 hours for the 6Z and 18Z runs.
JMAThe selected variable and region is available, but not for 2025-07-04, 18:00. You will switch back to the first available time step. The global weather forecast model of the Japanese weather service offers data up to 7 days into the future.
GCGFSThe selected time, variable and region is available for this model. The GraphCast Global Forecast System (GraphCastGFS) is an experimental system set up by the National Centers for Environmental Prediction (NCEP) to produce medium range global forecasts. The horizontal resolution is a 0.25 degree latitude-longitude grid (about 28 km). The model runs 4 times a day at 00Z, 06Z, 12Z and 18Z cycles. The products are 6 hourly forecasts up to 10 days. See more info here.
NAVGEMThe selected variable and region is available, but not for 2025-07-04, 18:00. You will switch back to the first available time step. NAVGEM is a model run by the NOAA and serves the US navy with weather forecasts. The WZ maps are based on data that is available from the NCEP server with a grid spacing of 0.5 degree and is updated twice daily (7 and 19 UTC).
UKMOThe selected variable and region is available, but not for 2025-07-04, 18:00. You will switch back to the first available time step. Model output from the United Kingdom Met Office (UKMO). Maps are updated twice daily around 6:45 und 18:45 UTC. Only basic pressure maps are available and forecast data ranges from day 3 to 6.
UKMO EUThe selected variable and region is available, but not for 2025-07-04, 18:00. You will switch back to the first available time step.


Member:
OP 0Fri 04 Jul 18:00
24Sat 05 Jul 18:00
48Sun 06 Jul 18:00
72Mon 07 Jul 18:00
96Tue 08 Jul 18:00
120Wed 09 Jul 18:00
144Thu 10 Jul 18:00
168Fri 11 Jul 18:00
192Sat 12 Jul 18:00
216Sun 13 Jul 18:00
240Mon 14 Jul 18:00
264Tue 15 Jul 18:00
288Wed 16 Jul 18:00
312Thu 17 Jul 18:00
336Fri 18 Jul 18:00
360Sat 19 Jul 18:00
384Sun 20 Jul 18:00
408Mon 21 Jul 18:00
432Tue 22 Jul 18:00
456Wed 23 Jul 18:00
480Thu 24 Jul 18:00
504Fri 25 Jul 18:00
528Sat 26 Jul 18:00
552Sun 27 Jul 18:00
576Mon 28 Jul 18:00
600Tue 29 Jul 18:00
624Wed 30 Jul 18:00
648Thu 31 Jul 18:00
672Fri 01 Aug 18:00
696Sat 02 Aug 18:00
720Sun 03 Aug 18:00
744Mon 04 Aug 18:00
768Tue 05 Aug 18:00
792Wed 06 Aug 18:00
816Thu 07 Aug 18:00
840Fri 08 Aug 18:00
864Sat 09 Aug 18:00
888Sun 10 Aug 18:00
912Mon 11 Aug 18:00
936Tue 12 Aug 18:00
960Wed 13 Aug 18:00
984Thu 14 Aug 18:00
1008Fri 15 Aug 18:00
1032Sat 16 Aug 18:00
1056Sun 17 Aug 18:00
1080Mon 18 Aug 18:00
1104Tue 19 Aug 18:00
1128Wed 20 Aug 18:00
1152Thu 21 Aug 18:00
1176Fri 22 Aug 18:00
1200Sat 23 Aug 18:00
1224Sun 24 Aug 18:00
1248Mon 25 Aug 18:00
1272Tue 26 Aug 18:00
1296Wed 27 Aug 18:00
1320Thu 28 Aug 18:00
1344Fri 29 Aug 18:00
1368Sat 30 Aug 18:00
1392Sun 31 Aug 18:00
1416Mon 01 Sep 18:00
1440Tue 02 Sep 18:00
1464Wed 03 Sep 18:00
1488Thu 04 Sep 18:00
1512Fri 05 Sep 18:00
1536Sat 06 Sep 18:00
1560Sun 07 Sep 18:00
1584Mon 08 Sep 18:00
1608Tue 09 Sep 18:00
1632Wed 10 Sep 18:00
1656Thu 11 Sep 18:00
1680Fri 12 Sep 18:00
1704Sat 13 Sep 18:00
1728Sun 14 Sep 18:00
1752Mon 15 Sep 18:00
1776Tue 16 Sep 18:00
1800Wed 17 Sep 18:00
1824Thu 18 Sep 18:00
1848Fri 19 Sep 18:00
1872Sat 20 Sep 18:00
1896Sun 21 Sep 18:00
1920Mon 22 Sep 18:00
1944Tue 23 Sep 18:00
1968Wed 24 Sep 18:00
1992Thu 25 Sep 18:00
2016Fri 26 Sep 18:00
2040Sat 27 Sep 18:00
2064Sun 28 Sep 18:00
2088Mon 29 Sep 18:00
2112Tue 30 Sep 18:00
2136Wed 01 Oct 18:00
2160Thu 02 Oct 18:00
2184Fri 03 Oct 18:00
2208Sat 04 Oct 18:00
2232Sun 05 Oct 18:00
2256Mon 06 Oct 18:00
2280Tue 07 Oct 18:00
2304Wed 08 Oct 18:00
2328Thu 09 Oct 18:00
2352Fri 10 Oct 18:00
2376Sat 11 Oct 18:00
2400Sun 12 Oct 18:00
2424Mon 13 Oct 18:00
2448Tue 14 Oct 18:00
2472Wed 15 Oct 18:00
2496Thu 16 Oct 18:00
2520Fri 17 Oct 18:00
2544Sat 18 Oct 18:00
2568Sun 19 Oct 18:00
2592Mon 20 Oct 18:00
2616Tue 21 Oct 18:00
2640Wed 22 Oct 18:00
2664Thu 23 Oct 18:00
2688Fri 24 Oct 18:00
2712Sat 25 Oct 18:00
2736Sun 26 Oct 18:00
2760Mon 27 Oct 18:00
2784Tue 28 Oct 18:00
2808Wed 29 Oct 18:00
2832Thu 30 Oct 18:00
2856Fri 31 Oct 18:00
2880Sat 01 Nov 18:00
2904Sun 02 Nov 18:00
2928Mon 03 Nov 18:00
2952Tue 04 Nov 18:00
2976Wed 05 Nov 18:00
3000Thu 06 Nov 18:00
3024Fri 07 Nov 18:00
3048Sat 08 Nov 18:00
3072Sun 09 Nov 18:00
3096Mon 10 Nov 18:00
3120Tue 11 Nov 18:00
3144Wed 12 Nov 18:00
3168Thu 13 Nov 18:00
3192Fri 14 Nov 18:00
3216Sat 15 Nov 18:00
3240Sun 16 Nov 18:00
3264Mon 17 Nov 18:00
3288Tue 18 Nov 18:00
3312Wed 19 Nov 18:00
3336Thu 20 Nov 18:00
3360Fri 21 Nov 18:00
3384Sat 22 Nov 18:00
3408Sun 23 Nov 18:00
3432Mon 24 Nov 18:00
3456Tue 25 Nov 18:00
3480Wed 26 Nov 18:00
3504Thu 27 Nov 18:00
3528Fri 28 Nov 18:00
3552Sat 29 Nov 18:00
3576Sun 30 Nov 18:00
3600Mon 01 Dec 18:00
3624Tue 02 Dec 18:00
3648Wed 03 Dec 18:00
3672Thu 04 Dec 18:00
3696Fri 05 Dec 18:00
3720Sat 06 Dec 18:00
3744Sun 07 Dec 18:00
3768Mon 08 Dec 18:00
3792Tue 09 Dec 18:00
3816Wed 10 Dec 18:00
3840Thu 11 Dec 18:00
3864Fri 12 Dec 18:00
3888Sat 13 Dec 18:00
3912Sun 14 Dec 18:00
3936Mon 15 Dec 18:00
3960Tue 16 Dec 18:00
3984Wed 17 Dec 18:00
4008Thu 18 Dec 18:00
help
Download GIF
click
Single-variable mode
You are now in the multi variable mode. Select all the variables of interest and they will be plotted side-by-side in a grid.
You are now in the multi variable mode. Select all the variables of interest and they will be plotted side-by-side in a grid.
URL of this map