

6Mon 14 Jul 06:00
12Mon 14 Jul 12:00
18Mon 14 Jul 18:00
24Tue 15 Jul 00:00
30Tue 15 Jul 06:00
36Tue 15 Jul 12:00
42Tue 15 Jul 18:00
48Wed 16 Jul 00:00
54Wed 16 Jul 06:00
60Wed 16 Jul 12:00
66Wed 16 Jul 18:00
72Thu 17 Jul 00:00
78Thu 17 Jul 06:00
84Thu 17 Jul 12:00
90Thu 17 Jul 18:00
96Fri 18 Jul 00:00
102Fri 18 Jul 06:00
108Fri 18 Jul 12:00
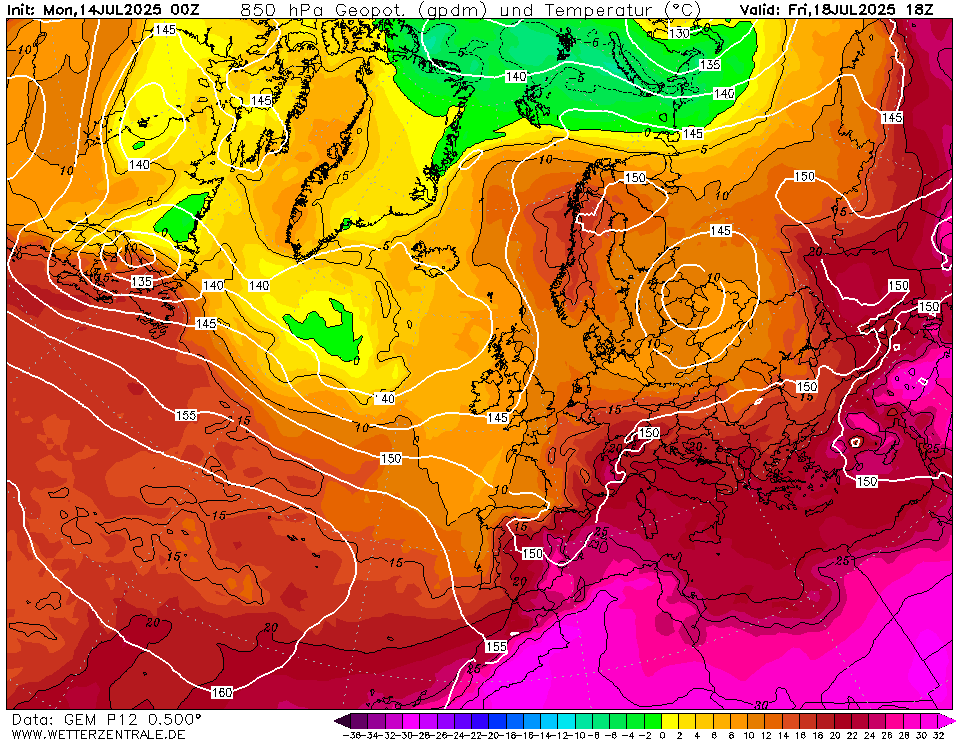
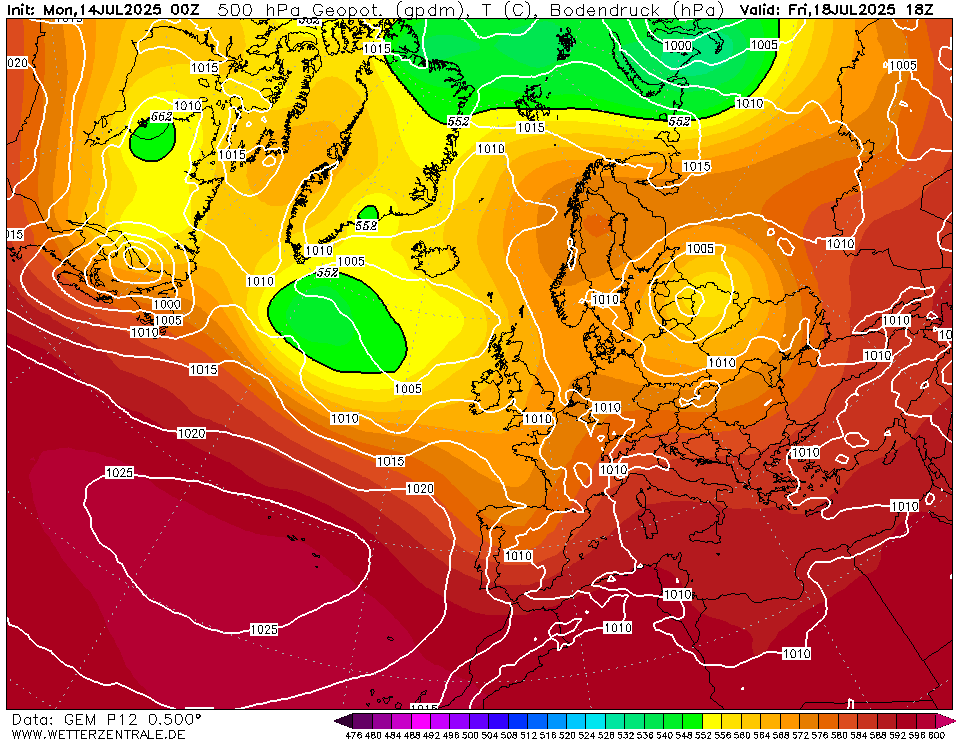
114Fri 18 Jul 18:00
120Sat 19 Jul 00:00
126Sat 19 Jul 06:00
132Sat 19 Jul 12:00
138Sat 19 Jul 18:00
144Sun 20 Jul 00:00
150Sun 20 Jul 06:00
156Sun 20 Jul 12:00
162Sun 20 Jul 18:00
168Mon 21 Jul 00:00
174Mon 21 Jul 06:00
180Mon 21 Jul 12:00
186Mon 21 Jul 18:00
192Tue 22 Jul 00:00
198Tue 22 Jul 06:00
204Tue 22 Jul 12:00
210Tue 22 Jul 18:00
216Wed 23 Jul 00:00
222Wed 23 Jul 06:00
228Wed 23 Jul 12:00
234Wed 23 Jul 18:00
240Thu 24 Jul 00:00
246Thu 24 Jul 06:00
252Thu 24 Jul 12:00
258Thu 24 Jul 18:00
264Fri 25 Jul 00:00
270Fri 25 Jul 06:00
276Fri 25 Jul 12:00
282Fri 25 Jul 18:00
288Sat 26 Jul 00:00
294Sat 26 Jul 06:00
300Sat 26 Jul 12:00
306Sat 26 Jul 18:00
312Sun 27 Jul 00:00
318Sun 27 Jul 06:00
324Sun 27 Jul 12:00
330Sun 27 Jul 18:00
336Mon 28 Jul 00:00
342Mon 28 Jul 06:00
348Mon 28 Jul 12:00
354Mon 28 Jul 18:00
360Tue 29 Jul 00:00
366Tue 29 Jul 06:00
372Tue 29 Jul 12:00
378Tue 29 Jul 18:00
384Wed 30 Jul 00:00
help
Download GIF
hover
Single-variable mode
You are now in the multi variable mode. Select all the variables of interest and they will be plotted side-by-side in a grid.
You are now in the multi variable mode. Select all the variables of interest and they will be plotted side-by-side in a grid.
URL of this map