AROME (NMI)The selected time, variable and region is available for this model.
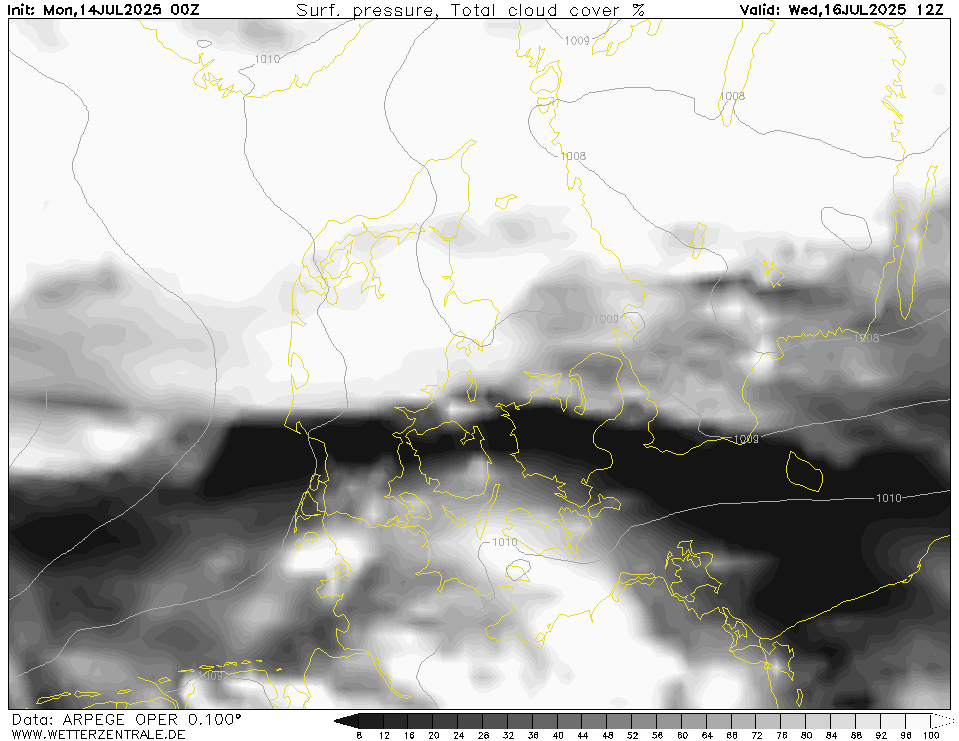
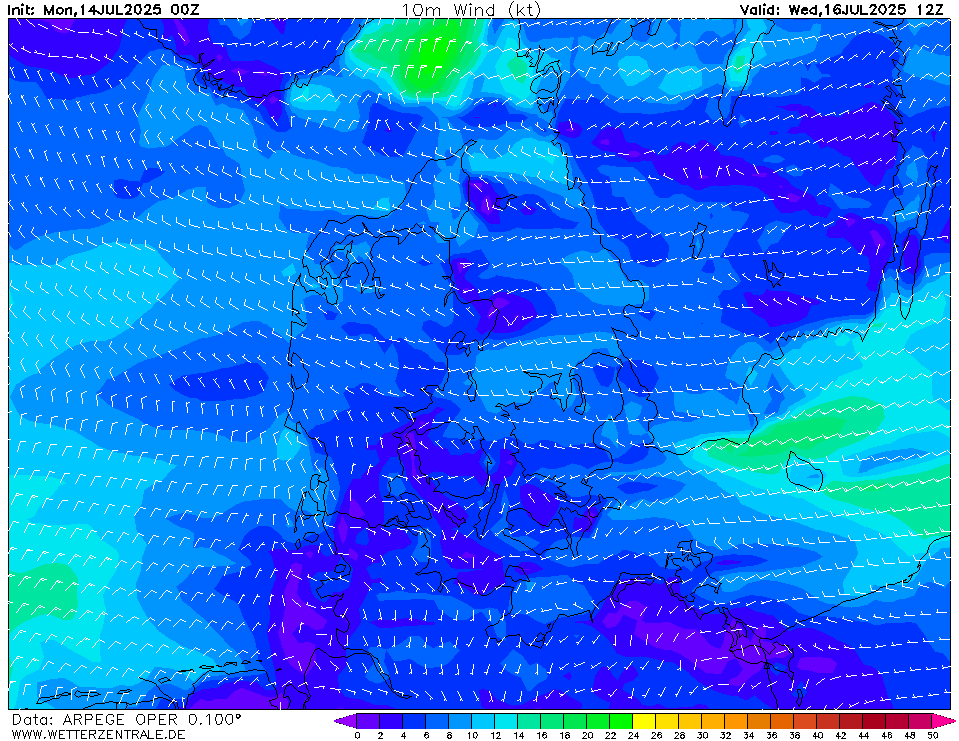
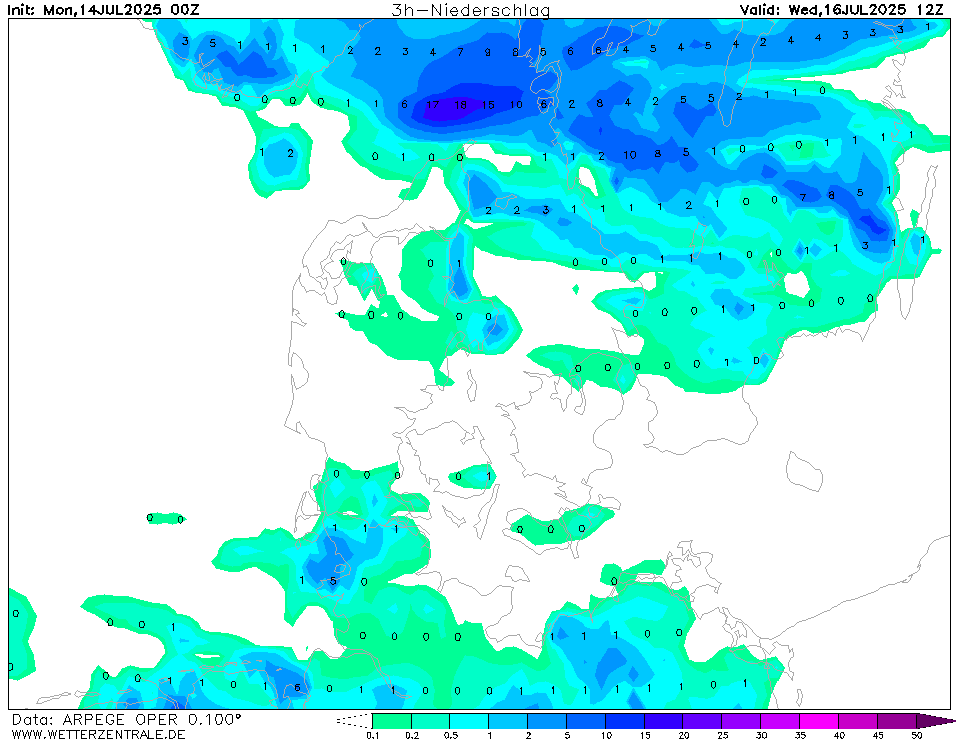
ARPEGECurrently selected. ARPEGE is the global forecast model of the French weather service (Meteo France). It is runs with a maximum resolution of approx. 7 km in Europe and mean global grid spacing of 15 km. WZ offers forecasts up to 102 hours.
HARMONIE (FMI)The selected time, variable and region is available for this model. HARMONIE is a mesoscale weather prediction model managed by the Finnish Meteorological Institute. The data is updated 4 times a day at 00, 06, 12 and 18 UTC. Corresponding model runs are available roughly five hours after analysis time (~ after model run has started).
HARMONIE (KNMI-EU)The selected variable and region is available, but not for 2025-07-16, 12:00. You will switch back to the first available time step. HARMONIE is developed in a european consortium and this is the output provided by the KNMI at the supercomputing facilities in Iceland. The output from Cy43 is available at a rotated lat-lon grid and regridded at our server to a grid spacing of 0.05 degree. These data are the raw data provided by the KNMI. The model is reinitialized every hour and run up to 60 hrs ahead.
UKMO EUThe selected variable and region is available, but not for 2025-07-16, 12:00. You will switch back to the first available time step.


Member:
OP 6Mon 14 Jul 06:00
9Mon 14 Jul 09:00
12Mon 14 Jul 12:00
15Mon 14 Jul 15:00
18Mon 14 Jul 18:00
21Mon 14 Jul 21:00
24Tue 15 Jul 00:00
27Tue 15 Jul 03:00
30Tue 15 Jul 06:00
33Tue 15 Jul 09:00
36Tue 15 Jul 12:00
39Tue 15 Jul 15:00
42Tue 15 Jul 18:00
45Tue 15 Jul 21:00
48Wed 16 Jul 00:00
51Wed 16 Jul 03:00
54Wed 16 Jul 06:00
57Wed 16 Jul 09:00
60Wed 16 Jul 12:00
63Wed 16 Jul 15:00
66Wed 16 Jul 18:00
69Wed 16 Jul 21:00
72Thu 17 Jul 00:00
75Thu 17 Jul 03:00
78Thu 17 Jul 06:00
81Thu 17 Jul 09:00
84Thu 17 Jul 12:00
87Thu 17 Jul 15:00
90Thu 17 Jul 18:00
93Thu 17 Jul 21:00
96Fri 18 Jul 00:00
99Fri 18 Jul 03:00
102Fri 18 Jul 06:00
help
Download GIF
hover
Single-variable mode
You are now in the multi variable mode. Select all the variables of interest and they will be plotted side-by-side in a grid.
You are now in the multi variable mode. Select all the variables of interest and they will be plotted side-by-side in a grid.
URL of this map