AIFSThe selected variable and region is available, but not for 2025-07-04, 04:00. You will switch back to the first available time step. ECMWF runs the Artificial Intelligence/Integrated Forecasting System (AIFS). The output of this AIFS experimental model is forecast with 6-hourly time steps out to 15 days initialised from the ECMWF operational analysis. Forecasts are produced four times per day (00/06/12/18UTC). The data are released 1 hour after the real-time. See more info here.
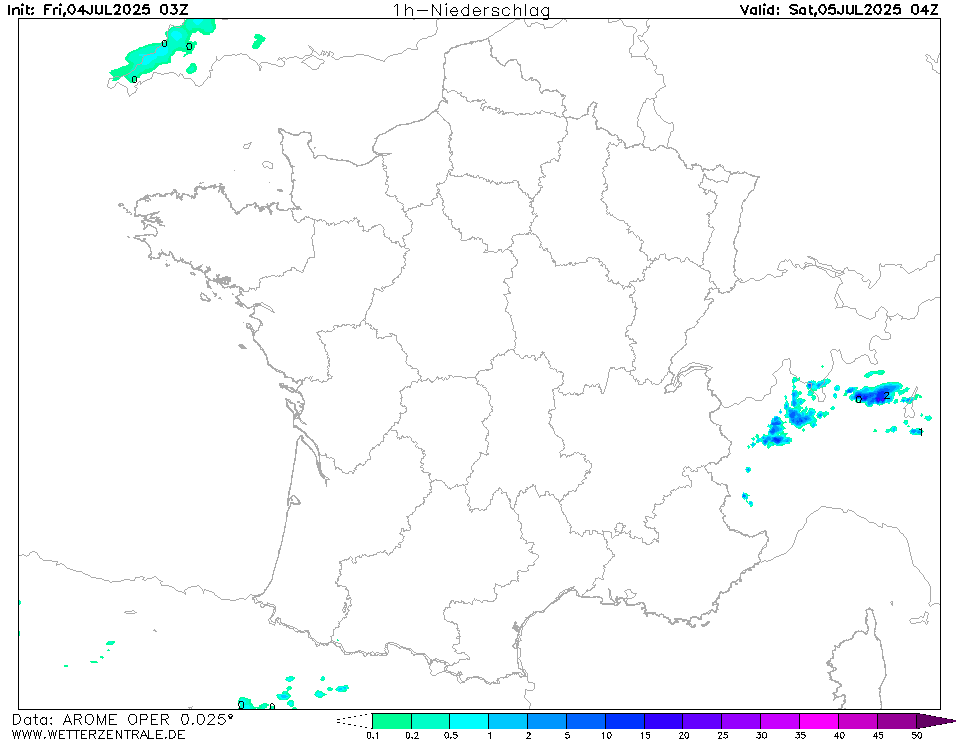
AROMECurrently selected. AROME is a high resolution (2.5 km) weather forecast model which is used by various weather services in Europe. On the WZ, forecasts from Meteo France and the Norwegian Weather Service are shown for western Europe and northern Europe, respectively.
ARPEGEThe selected variable and region is available, but not for 2025-07-04, 04:00. You will switch back to the first available time step. ARPEGE is the global forecast model of the French weather service (Meteo France). It is runs with a maximum resolution of approx. 7 km in Europe and mean global grid spacing of 15 km. WZ offers forecasts up to 102 hours.
COAMPSThe selected variable and region is available, but not for 2025-07-04, 04:00. You will switch back to the first available time step.
ECMWFThe selected variable and region is available, but not for 2025-07-04, 04:00. You will switch back to the first available time step. The European Centre for Medium-Range Weather Forecasts (ECMWF) creates forecasts for the upcoming 15 days and is a global leader in forecast skill. However, it offers only a small number of parameters for free. The 00Z and 12Z runs are coming in twice daily between 6 and 7 UTC and 18 and 19 UTC.
GEMThe selected variable and region is available, but not for 2025-07-04, 04:00. You will switch back to the first available time step. GEM is the global forecast model of the Canadian weather service and computes 10 day forecasts.
GFSThe selected time, variable and region is available for this model. GFS is the global weather forecast model of the US weather service run at an internal resolution of 28 km. It offers a plethora of parameters for the next 15 days. Updated 4 times a day up to 384 hours ahead. The runs for the 0, 6, 12 and 18Z runs are usually coming in from 3:30, 9:30, 15:30 and 21:30 UTC, respectively.
HARMONIE (KNMI-EU)The selected variable and region is available, but not for 2025-07-04, 04:00. You will switch back to the first available time step. HARMONIE is developed in a european consortium and this is the output provided by the KNMI at the supercomputing facilities in Iceland. The output from Cy43 is available at a rotated lat-lon grid and regridded at our server to a grid spacing of 0.05 degree. These data are the raw data provided by the KNMI. The model is reinitialized every hour and run up to 60 hrs ahead.
ICONThe selected time, variable and region is available for this model. ICON is the global weather forecast of the German weather service (DWD) with a grid spacing of approx. 13 km globally (Europe nest: 6 km). Model output is available up to 180 hours ahead for the 0Z and 12Z runs, and up to 120 hours for the 6Z and 18Z runs.
IRIEThe selected variable and region is available, but not for 2025-07-04, 04:00. You will switch back to the first available time step.
GCGFSThe selected variable and region is available, but not for 2025-07-04, 04:00. You will switch back to the first available time step. The GraphCast Global Forecast System (GraphCastGFS) is an experimental system set up by the National Centers for Environmental Prediction (NCEP) to produce medium range global forecasts. The horizontal resolution is a 0.25 degree latitude-longitude grid (about 28 km). The model runs 4 times a day at 00Z, 06Z, 12Z and 18Z cycles. The products are 6 hourly forecasts up to 10 days. See more info here.
UKMO EUThe selected variable and region is available, but not for 2025-07-04, 04:00. You will switch back to the first available time step.


2Thu 03 Jul 05:00
3Thu 03 Jul 06:00
4Thu 03 Jul 07:00
5Thu 03 Jul 08:00
6Thu 03 Jul 09:00
7Thu 03 Jul 10:00
8Thu 03 Jul 11:00
9Thu 03 Jul 12:00
10Thu 03 Jul 13:00
11Thu 03 Jul 14:00
12Thu 03 Jul 15:00
13Thu 03 Jul 16:00
14Thu 03 Jul 17:00
15Thu 03 Jul 18:00
16Thu 03 Jul 19:00
17Thu 03 Jul 20:00
18Thu 03 Jul 21:00
19Thu 03 Jul 22:00
20Thu 03 Jul 23:00
21Fri 04 Jul 00:00
22Fri 04 Jul 01:00
23Fri 04 Jul 02:00
24Fri 04 Jul 03:00
25Fri 04 Jul 04:00
26Fri 04 Jul 05:00
27Fri 04 Jul 06:00
28Fri 04 Jul 07:00
29Fri 04 Jul 08:00
30Fri 04 Jul 09:00
31Fri 04 Jul 10:00
32Fri 04 Jul 11:00
33Fri 04 Jul 12:00
34Fri 04 Jul 13:00
35Fri 04 Jul 14:00
36Fri 04 Jul 15:00
37Fri 04 Jul 16:00
38Fri 04 Jul 17:00
39Fri 04 Jul 18:00
40Fri 04 Jul 19:00
41Fri 04 Jul 20:00
42Fri 04 Jul 21:00
43Fri 04 Jul 22:00
44Fri 04 Jul 23:00
45Sat 05 Jul 00:00
46Sat 05 Jul 01:00
47Sat 05 Jul 02:00
48Sat 05 Jul 03:00
49Sat 05 Jul 04:00
50Sat 05 Jul 05:00
51Sat 05 Jul 06:00
help
Download GIF
hover
Single-variable mode
You are now in the multi variable mode. Select all the variables of interest and they will be plotted side-by-side in a grid.
You are now in the multi variable mode. Select all the variables of interest and they will be plotted side-by-side in a grid.
URL of this map