AIFSThe selected variable and region is available, but not for 2025-06-14, 00:00. You will switch back to the first available time step. ECMWF runs the Artificial Intelligence/Integrated Forecasting System (AIFS). The output of this AIFS experimental model is forecast with 6-hourly time steps out to 15 days initialised from the ECMWF operational analysis. Forecasts are produced four times per day (00/06/12/18UTC). The data are released 1 hour after the real-time. See more info here.
ECMWFThe selected variable and region is available, but not for 2025-06-14, 00:00. You will switch back to the first available time step. The European Centre for Medium-Range Weather Forecasts (ECMWF) creates forecasts for the upcoming 15 days and is a global leader in forecast skill. However, it offers only a small number of parameters for free. The 00Z and 12Z runs are coming in twice daily between 6 and 7 UTC and 18 and 19 UTC.
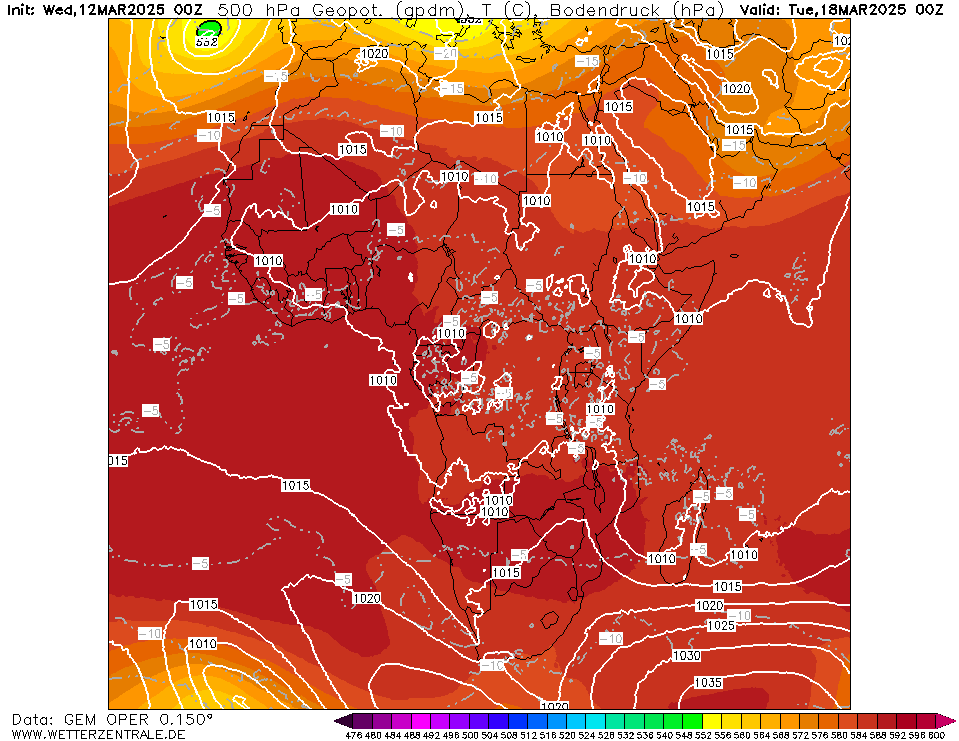
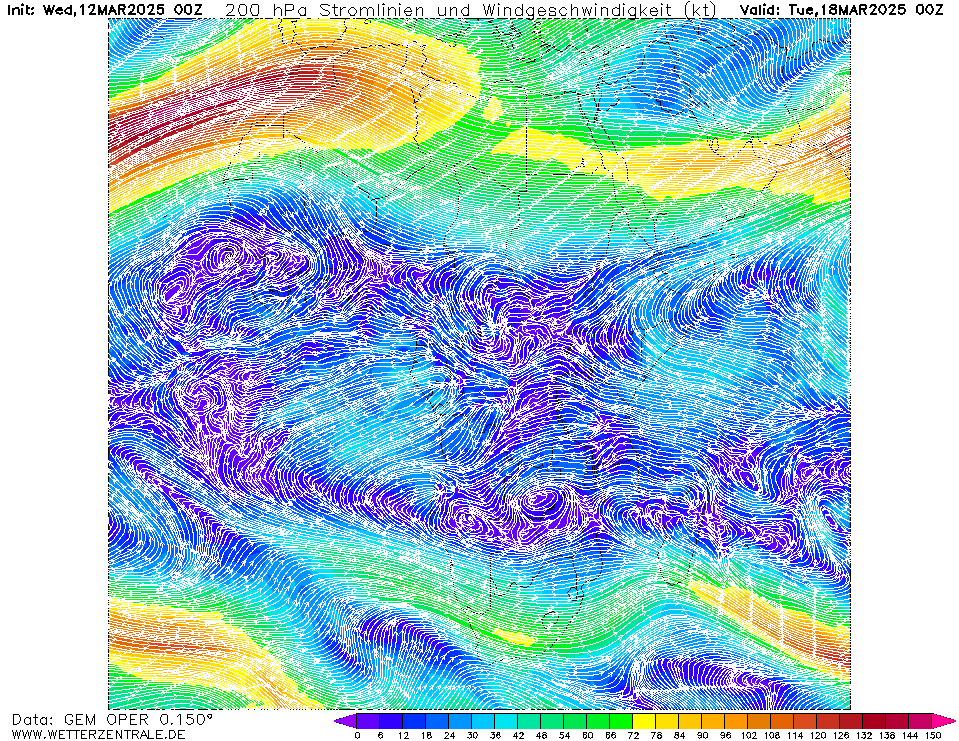
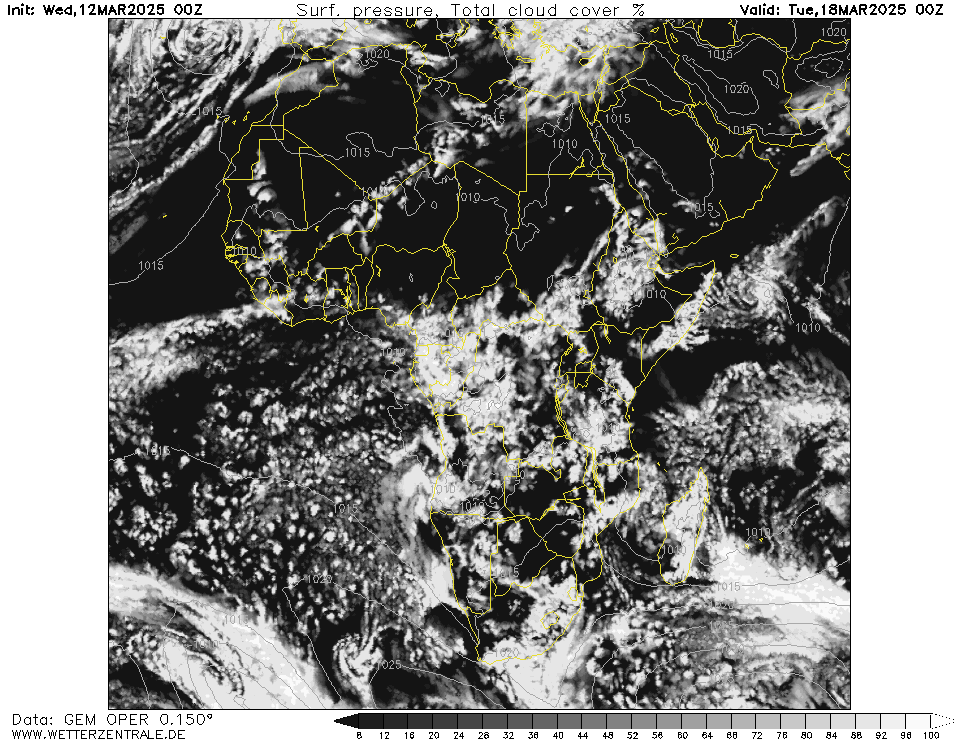
GEMCurrently selected. GEM is the global forecast model of the Canadian weather service and computes 10 day forecasts.
GFSThe selected variable and region is available, but not for 2025-06-14, 00:00. You will switch back to the first available time step. GFS is the global weather forecast model of the US weather service run at an internal resolution of 28 km. It offers a plethora of parameters for the next 15 days. Updated 4 times a day up to 384 hours ahead. The runs for the 0, 6, 12 and 18Z runs are usually coming in from 3:30, 9:30, 15:30 and 21:30 UTC, respectively.
GCGFSThe selected variable and region is available, but not for 2025-06-14, 00:00. You will switch back to the first available time step. The GraphCast Global Forecast System (GraphCastGFS) is an experimental system set up by the National Centers for Environmental Prediction (NCEP) to produce medium range global forecasts. The horizontal resolution is a 0.25 degree latitude-longitude grid (about 28 km). The model runs 4 times a day at 00Z, 06Z, 12Z and 18Z cycles. The products are 6 hourly forecasts up to 10 days. See more info here.
UKMOThe selected variable and region is available, but not for 2025-06-14, 00:00. You will switch back to the first available time step. Model output from the United Kingdom Met Office (UKMO). Maps are updated twice daily around 6:45 und 18:45 UTC. Only basic pressure maps are available and forecast data ranges from day 3 to 6.


Member:
OP 0Sun 08 Jun 00:00
6Sun 08 Jun 06:00
12Sun 08 Jun 12:00
18Sun 08 Jun 18:00
24Mon 09 Jun 00:00
30Mon 09 Jun 06:00
36Mon 09 Jun 12:00
42Mon 09 Jun 18:00
48Tue 10 Jun 00:00
54Tue 10 Jun 06:00
60Tue 10 Jun 12:00
66Tue 10 Jun 18:00
72Wed 11 Jun 00:00
78Wed 11 Jun 06:00
84Wed 11 Jun 12:00
90Wed 11 Jun 18:00
96Thu 12 Jun 00:00
102Thu 12 Jun 06:00
108Thu 12 Jun 12:00
114Thu 12 Jun 18:00
120Fri 13 Jun 00:00
126Fri 13 Jun 06:00
132Fri 13 Jun 12:00
138Fri 13 Jun 18:00
144Sat 14 Jun 00:00
150Sat 14 Jun 06:00
156Sat 14 Jun 12:00
162Sat 14 Jun 18:00
168Sun 15 Jun 00:00
174Sun 15 Jun 06:00
180Sun 15 Jun 12:00
186Sun 15 Jun 18:00
192Mon 16 Jun 00:00
198Mon 16 Jun 06:00
204Mon 16 Jun 12:00
210Mon 16 Jun 18:00
216Tue 17 Jun 00:00
222Tue 17 Jun 06:00
228Tue 17 Jun 12:00
234Tue 17 Jun 18:00
240Wed 18 Jun 00:00
help
Download GIF
hover
Single-variable mode
You are now in the multi variable mode. Select all the variables of interest and they will be plotted side-by-side in a grid.
You are now in the multi variable mode. Select all the variables of interest and they will be plotted side-by-side in a grid.
URL of this map