AIFSThe selected variable and region is available, but not for 2025-07-11, 18:00. You will switch back to the first available time step. ECMWF runs the Artificial Intelligence/Integrated Forecasting System (AIFS). The output of this AIFS experimental model is forecast with 6-hourly time steps out to 15 days initialised from the ECMWF operational analysis. Forecasts are produced four times per day (00/06/12/18UTC). The data are released 1 hour after the real-time. See more info here.
ECMWFThe selected time, variable and region is available for this model. The European Centre for Medium-Range Weather Forecasts (ECMWF) creates forecasts for the upcoming 15 days and is a global leader in forecast skill. However, it offers only a small number of parameters for free. The 00Z and 12Z runs are coming in twice daily between 6 and 7 UTC and 18 and 19 UTC.
GEMThe selected variable and region is available, but not for 2025-07-11, 18:00. You will switch back to the first available time step. GEM is the global forecast model of the Canadian weather service and computes 10 day forecasts.
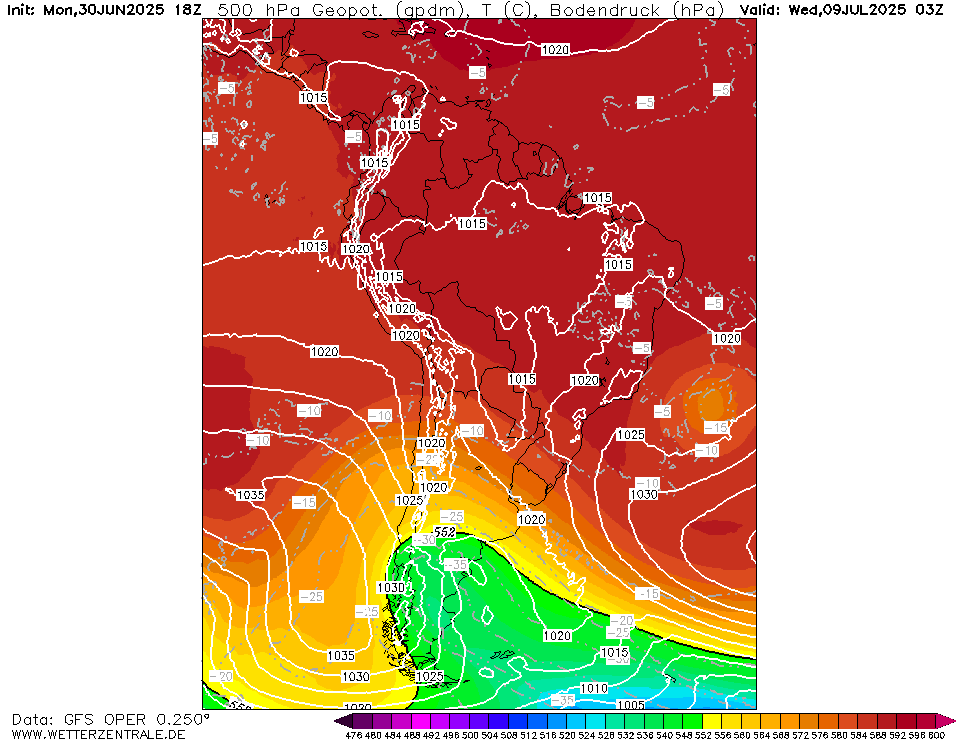
GFSCurrently selected. GFS is the global weather forecast model of the US weather service run at an internal resolution of 28 km. It offers a plethora of parameters for the next 15 days. Updated 4 times a day up to 384 hours ahead. The runs for the 0, 6, 12 and 18Z runs are usually coming in from 3:30, 9:30, 15:30 and 21:30 UTC, respectively.
ICONThe selected variable and region is available, but not for 2025-07-11, 18:00. You will switch back to the first available time step. ICON is the global weather forecast of the German weather service (DWD) with a grid spacing of approx. 13 km globally (Europe nest: 6 km). Model output is available up to 180 hours ahead for the 0Z and 12Z runs, and up to 120 hours for the 6Z and 18Z runs.
GCGFSThe selected variable and region is available, but not for 2025-07-11, 18:00. You will switch back to the first available time step. The GraphCast Global Forecast System (GraphCastGFS) is an experimental system set up by the National Centers for Environmental Prediction (NCEP) to produce medium range global forecasts. The horizontal resolution is a 0.25 degree latitude-longitude grid (about 28 km). The model runs 4 times a day at 00Z, 06Z, 12Z and 18Z cycles. The products are 6 hourly forecasts up to 10 days. See more info here.
UKMOThe selected variable and region is available, but not for 2025-07-11, 18:00. You will switch back to the first available time step. Model output from the United Kingdom Met Office (UKMO). Maps are updated twice daily around 6:45 und 18:45 UTC. Only basic pressure maps are available and forecast data ranges from day 3 to 6.


1Mon 30 Jun 19:00
2Mon 30 Jun 20:00
3Mon 30 Jun 21:00
4Mon 30 Jun 22:00
5Mon 30 Jun 23:00
6Tue 01 Jul 00:00
7Tue 01 Jul 01:00
8Tue 01 Jul 02:00
9Tue 01 Jul 03:00
10Tue 01 Jul 04:00
11Tue 01 Jul 05:00
12Tue 01 Jul 06:00
13Tue 01 Jul 07:00
14Tue 01 Jul 08:00
15Tue 01 Jul 09:00
16Tue 01 Jul 10:00
17Tue 01 Jul 11:00
18Tue 01 Jul 12:00
19Tue 01 Jul 13:00
20Tue 01 Jul 14:00
21Tue 01 Jul 15:00
22Tue 01 Jul 16:00
23Tue 01 Jul 17:00
24Tue 01 Jul 18:00
25Tue 01 Jul 19:00
26Tue 01 Jul 20:00
27Tue 01 Jul 21:00
28Tue 01 Jul 22:00
29Tue 01 Jul 23:00
30Wed 02 Jul 00:00
31Wed 02 Jul 01:00
32Wed 02 Jul 02:00
33Wed 02 Jul 03:00
34Wed 02 Jul 04:00
35Wed 02 Jul 05:00
36Wed 02 Jul 06:00
37Wed 02 Jul 07:00
38Wed 02 Jul 08:00
39Wed 02 Jul 09:00
40Wed 02 Jul 10:00
41Wed 02 Jul 11:00
42Wed 02 Jul 12:00
43Wed 02 Jul 13:00
44Wed 02 Jul 14:00
45Wed 02 Jul 15:00
46Wed 02 Jul 16:00
47Wed 02 Jul 17:00
48Wed 02 Jul 18:00
49Wed 02 Jul 19:00
50Wed 02 Jul 20:00
51Wed 02 Jul 21:00
52Wed 02 Jul 22:00
53Wed 02 Jul 23:00
54Thu 03 Jul 00:00
55Thu 03 Jul 01:00
56Thu 03 Jul 02:00
57Thu 03 Jul 03:00
58Thu 03 Jul 04:00
59Thu 03 Jul 05:00
60Thu 03 Jul 06:00
61Thu 03 Jul 07:00
62Thu 03 Jul 08:00
63Thu 03 Jul 09:00
64Thu 03 Jul 10:00
65Thu 03 Jul 11:00
66Thu 03 Jul 12:00
67Thu 03 Jul 13:00
68Thu 03 Jul 14:00
69Thu 03 Jul 15:00
70Thu 03 Jul 16:00
71Thu 03 Jul 17:00
72Thu 03 Jul 18:00
73Thu 03 Jul 19:00
74Thu 03 Jul 20:00
75Thu 03 Jul 21:00
76Thu 03 Jul 22:00
77Thu 03 Jul 23:00
78Fri 04 Jul 00:00
79Fri 04 Jul 01:00
80Fri 04 Jul 02:00
81Fri 04 Jul 03:00
82Fri 04 Jul 04:00
83Fri 04 Jul 05:00
84Fri 04 Jul 06:00
85Fri 04 Jul 07:00
86Fri 04 Jul 08:00
87Fri 04 Jul 09:00
88Fri 04 Jul 10:00
89Fri 04 Jul 11:00
90Fri 04 Jul 12:00
91Fri 04 Jul 13:00
92Fri 04 Jul 14:00
93Fri 04 Jul 15:00
94Fri 04 Jul 16:00
95Fri 04 Jul 17:00
96Fri 04 Jul 18:00
97Fri 04 Jul 19:00
98Fri 04 Jul 20:00
99Fri 04 Jul 21:00
100Fri 04 Jul 22:00
101Fri 04 Jul 23:00
102Sat 05 Jul 00:00
103Sat 05 Jul 01:00
104Sat 05 Jul 02:00
105Sat 05 Jul 03:00
106Sat 05 Jul 04:00
107Sat 05 Jul 05:00
108Sat 05 Jul 06:00
109Sat 05 Jul 07:00
110Sat 05 Jul 08:00
111Sat 05 Jul 09:00
112Sat 05 Jul 10:00
113Sat 05 Jul 11:00
114Sat 05 Jul 12:00
115Sat 05 Jul 13:00
116Sat 05 Jul 14:00
117Sat 05 Jul 15:00
118Sat 05 Jul 16:00
119Sat 05 Jul 17:00
120Sat 05 Jul 18:00
123Sat 05 Jul 21:00
126Sun 06 Jul 00:00
129Sun 06 Jul 03:00
132Sun 06 Jul 06:00
135Sun 06 Jul 09:00
138Sun 06 Jul 12:00
141Sun 06 Jul 15:00
144Sun 06 Jul 18:00
147Sun 06 Jul 21:00
150Mon 07 Jul 00:00
153Mon 07 Jul 03:00
156Mon 07 Jul 06:00
159Mon 07 Jul 09:00
162Mon 07 Jul 12:00
165Mon 07 Jul 15:00
168Mon 07 Jul 18:00
171Mon 07 Jul 21:00
174Tue 08 Jul 00:00
177Tue 08 Jul 03:00
180Tue 08 Jul 06:00
183Tue 08 Jul 09:00
186Tue 08 Jul 12:00
189Tue 08 Jul 15:00
192Tue 08 Jul 18:00
195Tue 08 Jul 21:00
198Wed 09 Jul 00:00
201Wed 09 Jul 03:00
help
Download GIF
hover
Single-variable mode
You are now in the multi variable mode. Select all the variables of interest and they will be plotted side-by-side in a grid.
You are now in the multi variable mode. Select all the variables of interest and they will be plotted side-by-side in a grid.
URL of this map