AIFSThe selected variable and region is available, but not for 2025-07-09, 06:00. You will switch back to the first available time step. ECMWF runs the Artificial Intelligence/Integrated Forecasting System (AIFS). The output of this AIFS experimental model is forecast with 6-hourly time steps out to 15 days initialised from the ECMWF operational analysis. Forecasts are produced four times per day (00/06/12/18UTC). The data are released 1 hour after the real-time. See more info here.
GFSThe selected time, variable and region is available for this model. GFS is the global weather forecast model of the US weather service run at an internal resolution of 28 km. It offers a plethora of parameters for the next 15 days. Updated 4 times a day up to 384 hours ahead. The runs for the 0, 6, 12 and 18Z runs are usually coming in from 3:30, 9:30, 15:30 and 21:30 UTC, respectively.
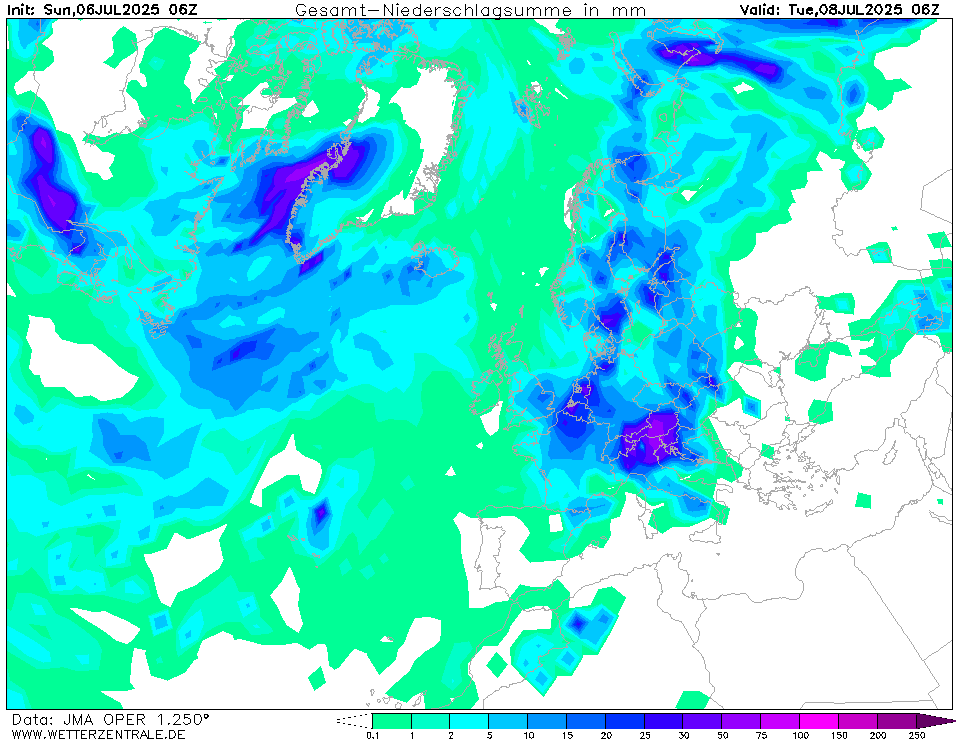
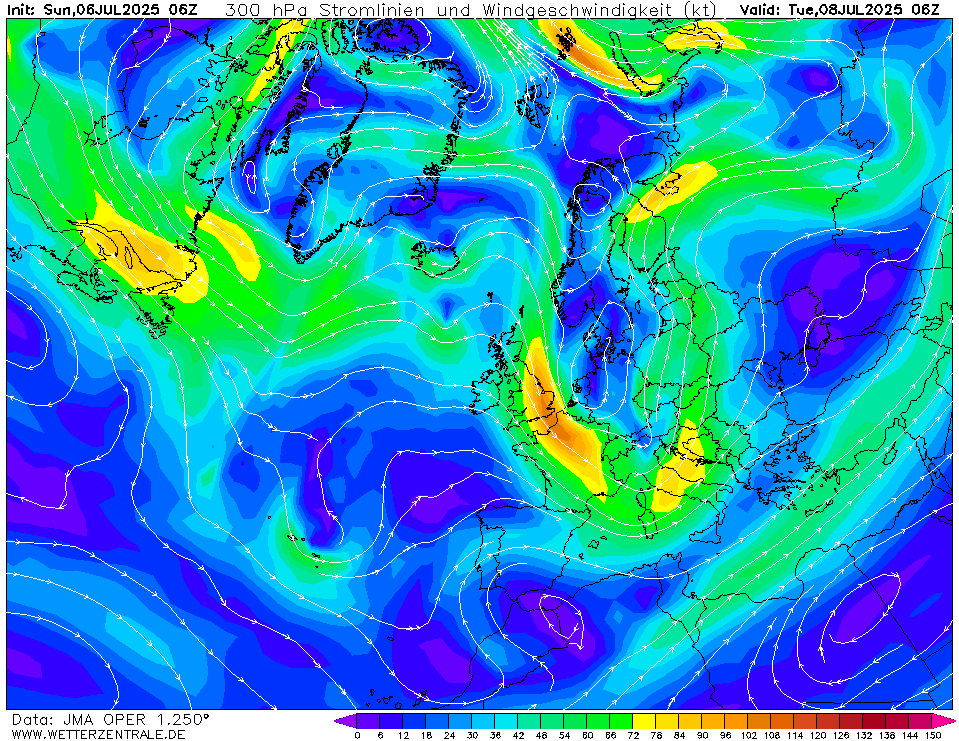
JMACurrently selected. The global weather forecast model of the Japanese weather service offers data up to 7 days into the future.
GCGFSThe selected time, variable and region is available for this model. The GraphCast Global Forecast System (GraphCastGFS) is an experimental system set up by the National Centers for Environmental Prediction (NCEP) to produce medium range global forecasts. The horizontal resolution is a 0.25 degree latitude-longitude grid (about 28 km). The model runs 4 times a day at 00Z, 06Z, 12Z and 18Z cycles. The products are 6 hourly forecasts up to 10 days. See more info here.
NAVGEMThe selected time, variable and region is available for this model. NAVGEM is a model run by the NOAA and serves the US navy with weather forecasts. The WZ maps are based on data that is available from the NCEP server with a grid spacing of 0.5 degree and is updated twice daily (7 and 19 UTC).
UKMO EUThe selected variable and region is available, but not for 2025-07-09, 06:00. You will switch back to the first available time step.


Member:
OP 6Mon 07 Jul 12:00
12Mon 07 Jul 18:00
18Tue 08 Jul 00:00
24Tue 08 Jul 06:00
30Tue 08 Jul 12:00
36Tue 08 Jul 18:00
42Wed 09 Jul 00:00
48Wed 09 Jul 06:00
54Wed 09 Jul 12:00
60Wed 09 Jul 18:00
66Thu 10 Jul 00:00
72Thu 10 Jul 06:00
78Thu 10 Jul 12:00
84Thu 10 Jul 18:00
90Fri 11 Jul 00:00
96Fri 11 Jul 06:00
102Fri 11 Jul 12:00
108Fri 11 Jul 18:00
114Sat 12 Jul 00:00
120Sat 12 Jul 06:00
126Sat 12 Jul 12:00
132Sat 12 Jul 18:00
help
Download GIF
hover
Single-variable mode
You are now in the multi variable mode. Select all the variables of interest and they will be plotted side-by-side in a grid.
You are now in the multi variable mode. Select all the variables of interest and they will be plotted side-by-side in a grid.
URL of this map