AIFSThe selected variable and region is available, but not for 2025-07-20, 12:00. You will switch back to the first available time step. ECMWF runs the Artificial Intelligence/Integrated Forecasting System (AIFS). The output of this AIFS experimental model is forecast with 6-hourly time steps out to 15 days initialised from the ECMWF operational analysis. Forecasts are produced four times per day (00/06/12/18UTC). The data are released 1 hour after the real-time. See more info here.
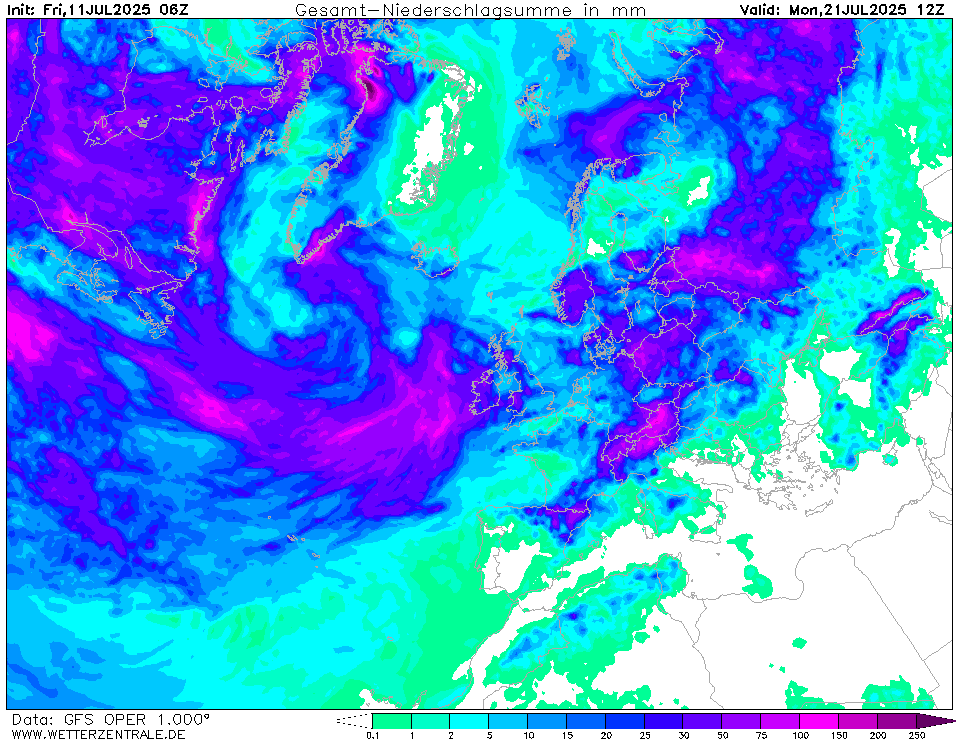
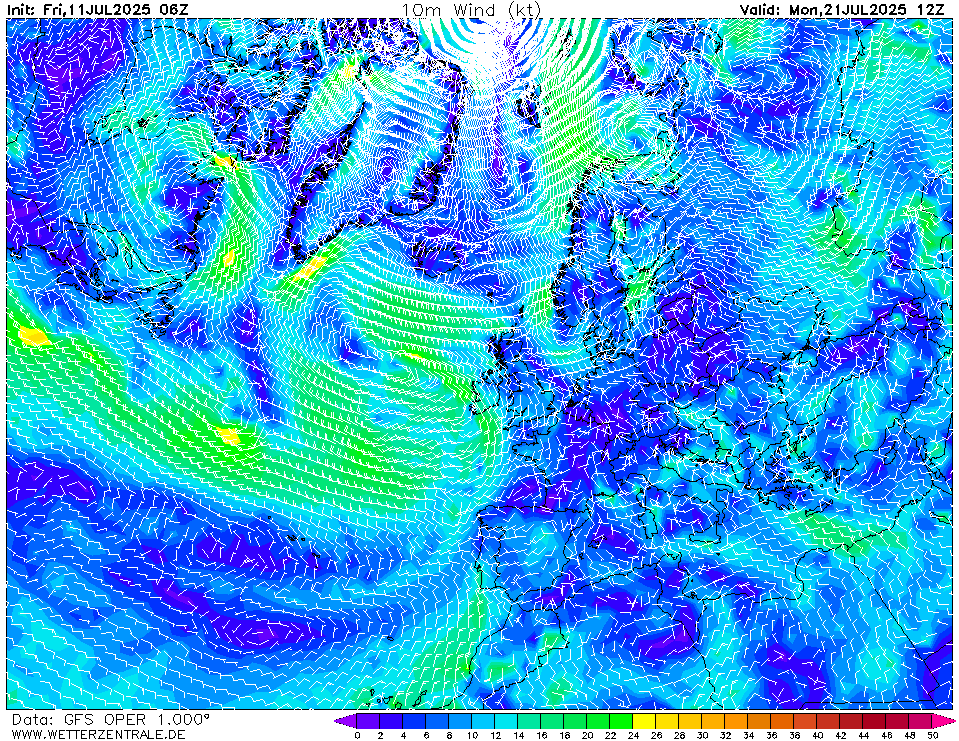
GFSCurrently selected. GFS is the global weather forecast model of the US weather service run at an internal resolution of 28 km. It offers a plethora of parameters for the next 15 days. Updated 4 times a day up to 384 hours ahead. The runs for the 0, 6, 12 and 18Z runs are usually coming in from 3:30, 9:30, 15:30 and 21:30 UTC, respectively.
JMAThe selected variable and region is available, but not for 2025-07-20, 12:00. You will switch back to the first available time step. The global weather forecast model of the Japanese weather service offers data up to 7 days into the future.
GCGFSThe selected time, variable and region is available for this model. The GraphCast Global Forecast System (GraphCastGFS) is an experimental system set up by the National Centers for Environmental Prediction (NCEP) to produce medium range global forecasts. The horizontal resolution is a 0.25 degree latitude-longitude grid (about 28 km). The model runs 4 times a day at 00Z, 06Z, 12Z and 18Z cycles. The products are 6 hourly forecasts up to 10 days. See more info here.
NAVGEMThe selected variable and region is available, but not for 2025-07-20, 12:00. You will switch back to the first available time step. NAVGEM is a model run by the NOAA and serves the US navy with weather forecasts. The WZ maps are based on data that is available from the NCEP server with a grid spacing of 0.5 degree and is updated twice daily (7 and 19 UTC).
UKMO EUThe selected variable and region is available, but not for 2025-07-20, 12:00. You will switch back to the first available time step.


3Thu 10 Jul 09:00
6Thu 10 Jul 12:00
9Thu 10 Jul 15:00
12Thu 10 Jul 18:00
15Thu 10 Jul 21:00
18Fri 11 Jul 00:00
21Fri 11 Jul 03:00
24Fri 11 Jul 06:00
27Fri 11 Jul 09:00
30Fri 11 Jul 12:00
33Fri 11 Jul 15:00
36Fri 11 Jul 18:00
39Fri 11 Jul 21:00
42Sat 12 Jul 00:00
45Sat 12 Jul 03:00
48Sat 12 Jul 06:00
51Sat 12 Jul 09:00
54Sat 12 Jul 12:00
57Sat 12 Jul 15:00
60Sat 12 Jul 18:00
63Sat 12 Jul 21:00
66Sun 13 Jul 00:00
69Sun 13 Jul 03:00
72Sun 13 Jul 06:00
75Sun 13 Jul 09:00
78Sun 13 Jul 12:00
81Sun 13 Jul 15:00
84Sun 13 Jul 18:00
87Sun 13 Jul 21:00
90Mon 14 Jul 00:00
93Mon 14 Jul 03:00
96Mon 14 Jul 06:00
99Mon 14 Jul 09:00
102Mon 14 Jul 12:00
105Mon 14 Jul 15:00
108Mon 14 Jul 18:00
111Mon 14 Jul 21:00
114Tue 15 Jul 00:00
117Tue 15 Jul 03:00
120Tue 15 Jul 06:00
123Tue 15 Jul 09:00
126Tue 15 Jul 12:00
129Tue 15 Jul 15:00
132Tue 15 Jul 18:00
135Tue 15 Jul 21:00
138Wed 16 Jul 00:00
141Wed 16 Jul 03:00
144Wed 16 Jul 06:00
147Wed 16 Jul 09:00
150Wed 16 Jul 12:00
153Wed 16 Jul 15:00
156Wed 16 Jul 18:00
159Wed 16 Jul 21:00
162Thu 17 Jul 00:00
165Thu 17 Jul 03:00
168Thu 17 Jul 06:00
171Thu 17 Jul 09:00
174Thu 17 Jul 12:00
177Thu 17 Jul 15:00
180Thu 17 Jul 18:00
183Thu 17 Jul 21:00
186Fri 18 Jul 00:00
189Fri 18 Jul 03:00
192Fri 18 Jul 06:00
195Fri 18 Jul 09:00
198Fri 18 Jul 12:00
201Fri 18 Jul 15:00
204Fri 18 Jul 18:00
207Fri 18 Jul 21:00
210Sat 19 Jul 00:00
213Sat 19 Jul 03:00
216Sat 19 Jul 06:00
219Sat 19 Jul 09:00
222Sat 19 Jul 12:00
225Sat 19 Jul 15:00
228Sat 19 Jul 18:00
231Sat 19 Jul 21:00
234Sun 20 Jul 00:00
237Sun 20 Jul 03:00
240Sun 20 Jul 06:00
243Sun 20 Jul 09:00
246Sun 20 Jul 12:00
249Sun 20 Jul 15:00
252Sun 20 Jul 18:00
255Sun 20 Jul 21:00
258Mon 21 Jul 00:00
261Mon 21 Jul 03:00
264Mon 21 Jul 06:00
267Mon 21 Jul 09:00
270Mon 21 Jul 12:00
273Mon 21 Jul 15:00
276Mon 21 Jul 18:00
279Mon 21 Jul 21:00
282Tue 22 Jul 00:00
285Tue 22 Jul 03:00
288Tue 22 Jul 06:00
291Tue 22 Jul 09:00
294Tue 22 Jul 12:00
297Tue 22 Jul 15:00
300Tue 22 Jul 18:00
303Tue 22 Jul 21:00
306Wed 23 Jul 00:00
309Wed 23 Jul 03:00
312Wed 23 Jul 06:00
315Wed 23 Jul 09:00
318Wed 23 Jul 12:00
321Wed 23 Jul 15:00
324Wed 23 Jul 18:00
327Wed 23 Jul 21:00
330Thu 24 Jul 00:00
333Thu 24 Jul 03:00
336Thu 24 Jul 06:00
339Thu 24 Jul 09:00
342Thu 24 Jul 12:00
345Thu 24 Jul 15:00
348Thu 24 Jul 18:00
351Thu 24 Jul 21:00
354Fri 25 Jul 00:00
357Fri 25 Jul 03:00
360Fri 25 Jul 06:00
363Fri 25 Jul 09:00
366Fri 25 Jul 12:00
369Fri 25 Jul 15:00
372Fri 25 Jul 18:00
375Fri 25 Jul 21:00
378Sat 26 Jul 00:00
381Sat 26 Jul 03:00
384Sat 26 Jul 06:00
help
Download GIF
hover
Single-variable mode
You are now in the multi variable mode. Select all the variables of interest and they will be plotted side-by-side in a grid.
You are now in the multi variable mode. Select all the variables of interest and they will be plotted side-by-side in a grid.
URL of this map