ECMWFThe selected time, variable and region is available for this model. The European Centre for Medium-Range Weather Forecasts (ECMWF) creates forecasts for the upcoming 15 days and is a global leader in forecast skill. However, it offers only a small number of parameters for free. The 00Z and 12Z runs are coming in twice daily between 6 and 7 UTC and 18 and 19 UTC.
GEMThe selected time, variable and region is available for this model. GEM is the global forecast model of the Canadian weather service and computes 10 day forecasts.
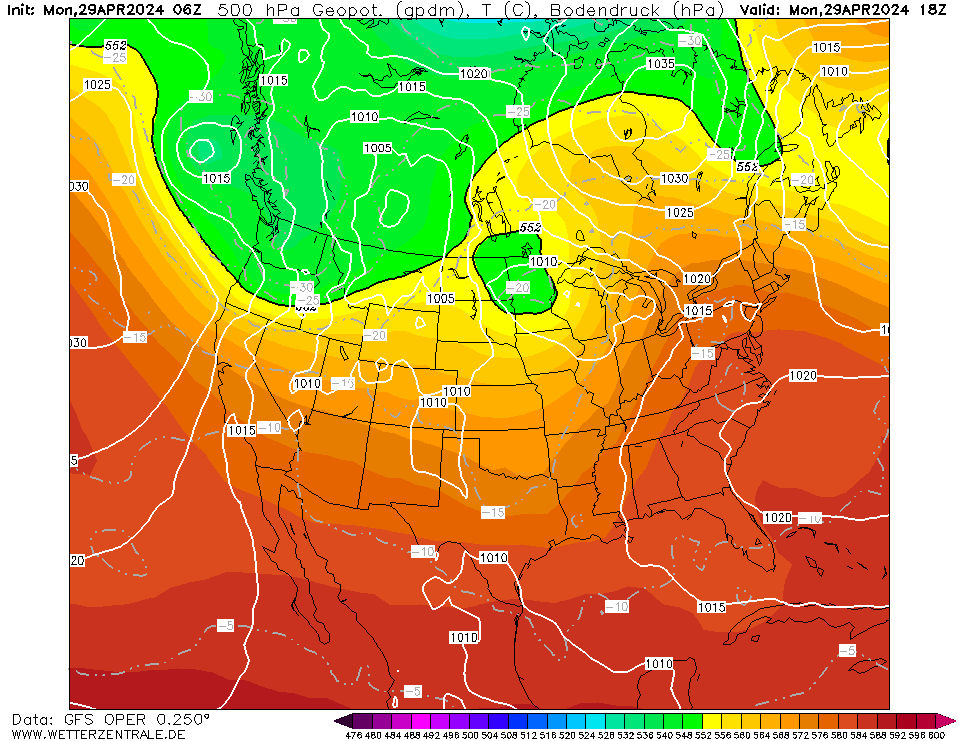
GFSCurrently selected. GFS is the global weather forecast model of the US weather service run at an internal resolution of 28 km. It offers a plethora of parameters for the next 15 days. Updated 4 times a day up to 384 hours ahead. The runs for the 0, 6, 12 and 18Z runs are usually coming in from 3:30, 9:30, 15:30 and 21:30 UTC, respectively.
ICONThe selected time, variable and region is available for this model. ICON is the global weather forecast of the German weather service (DWD) with a grid spacing of approx. 13 km globally (Europe nest: 6 km). Model output is available up to 180 hours ahead for the 0Z and 12Z runs, and up to 120 hours for the 6Z and 18Z runs.
JMAThe selected time, variable and region is available for this model. The global weather forecast model of the Japanese weather service offers data up to 7 days into the future.
NAVGEMThe selected time, variable and region is available for this model. NAVGEM is a model run by the NOAA and serves the US navy with weather forecasts. The WZ maps are based on data that is available from the NCEP server with a grid spacing of 0.5 degree and is updated twice daily (7 and 19 UTC).
UKMOThe selected time, variable and region is available for this model. Model output from the United Kingdom Met Office (UKMO). Maps are updated twice daily around 6:45 und 18:45 UTC. Only basic pressure maps are available and forecast data ranges from day 3 to 6.


12Mon 3 Jun 18:00
24Tue 4 Jun 06:00
36Tue 4 Jun 18:00
48Wed 5 Jun 06:00
60Wed 5 Jun 18:00
72Thu 6 Jun 06:00
84Thu 6 Jun 18:00
96Fri 7 Jun 06:00
108Fri 7 Jun 18:00
120Sat 8 Jun 06:00
132Sat 8 Jun 18:00
144Sun 9 Jun 06:00
156Sun 9 Jun 18:00
168Mon 10 Jun 06:00
180Mon 10 Jun 18:00
192Tue 11 Jun 06:00
204Tue 11 Jun 18:00
216Wed 12 Jun 06:00
228Wed 12 Jun 18:00
240Thu 13 Jun 06:00
252Thu 13 Jun 18:00
264Fri 14 Jun 06:00
276Fri 14 Jun 18:00
288Sat 15 Jun 06:00
300Sat 15 Jun 18:00
312Sun 16 Jun 06:00
324Sun 16 Jun 18:00
336Mon 17 Jun 06:00
348Mon 17 Jun 18:00
360Tue 18 Jun 06:00
372Tue 18 Jun 18:00
384Wed 19 Jun 06:00

help
Download GIF
hover
Single-variable mode
You are now in the multi variable mode. Select all the variables of interest and they will be plotted side-by-side in a grid.
You are now in the multi variable mode. Select all the variables of interest and they will be plotted side-by-side in a grid.
URL of this map