ARPEGEThe selected variable and region is available, but not for 2024-06-10, 18:00. You will switch back to the first available time step. ARPEGE is the global forecast model of the French weather service (Meteo France). It is runs with a maximum resolution of approx. 7 km in Europe and mean global grid spacing of 15 km. WZ offers forecasts up to 102 hours.
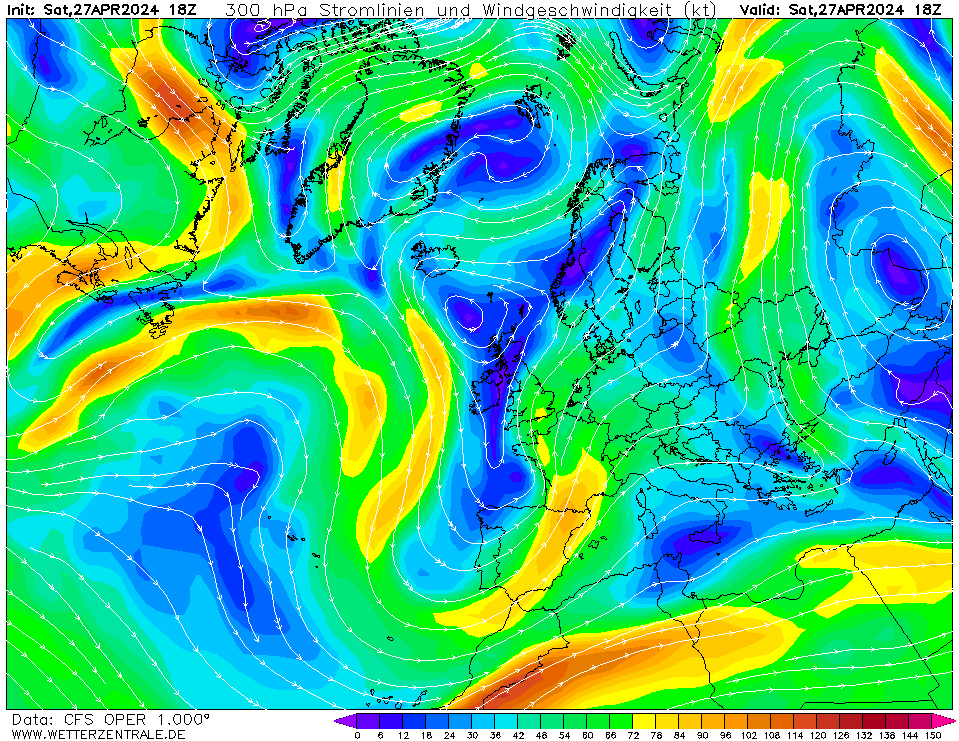
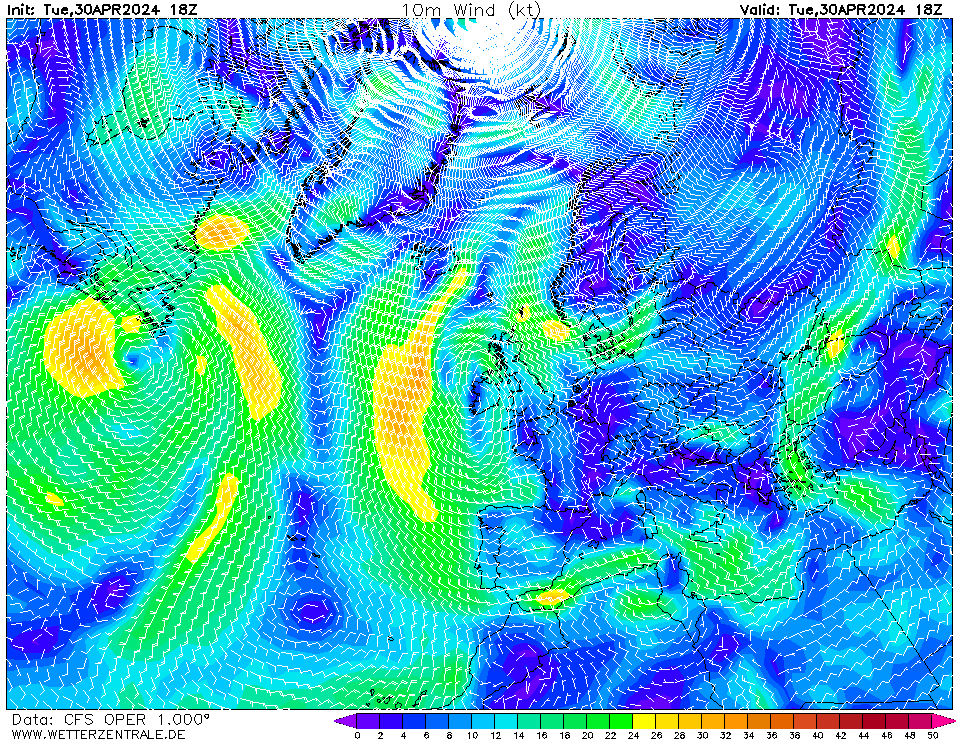
CFSCurrently selected.
GEMThe selected time, variable and region is available for this model. GEM is the global forecast model of the Canadian weather service and computes 10 day forecasts.
GFSThe selected time, variable and region is available for this model. GFS is the global weather forecast model of the US weather service run at an internal resolution of 28 km. It offers a plethora of parameters for the next 15 days. Updated 4 times a day up to 384 hours ahead. The runs for the 0, 6, 12 and 18Z runs are usually coming in from 3:30, 9:30, 15:30 and 21:30 UTC, respectively.
ICONThe selected time, variable and region is available for this model. ICON is the global weather forecast of the German weather service (DWD) with a grid spacing of approx. 13 km globally (Europe nest: 6 km). Model output is available up to 180 hours ahead for the 0Z and 12Z runs, and up to 120 hours for the 6Z and 18Z runs.
JMAThe selected time, variable and region is available for this model. The global weather forecast model of the Japanese weather service offers data up to 7 days into the future.
NAVGEMThe selected time, variable and region is available for this model. NAVGEM is a model run by the NOAA and serves the US navy with weather forecasts. The WZ maps are based on data that is available from the NCEP server with a grid spacing of 0.5 degree and is updated twice daily (7 and 19 UTC).
UKMO EUThe selected variable and region is available, but not for 2024-06-10, 18:00. You will switch back to the first available time step.


Member:
OP 0Mon 10 Jun 18:00
24Tue 11 Jun 18:00
48Wed 12 Jun 18:00
72Thu 13 Jun 18:00
96Fri 14 Jun 18:00
120Sat 15 Jun 18:00
144Sun 16 Jun 18:00
168Mon 17 Jun 18:00
192Tue 18 Jun 18:00
216Wed 19 Jun 18:00
240Thu 20 Jun 18:00
264Fri 21 Jun 18:00
288Sat 22 Jun 18:00
312Sun 23 Jun 18:00
336Mon 24 Jun 18:00
360Tue 25 Jun 18:00
384Wed 26 Jun 18:00
408Thu 27 Jun 18:00
432Fri 28 Jun 18:00
456Sat 29 Jun 18:00
480Sun 30 Jun 18:00
504Mon 1 Jul 18:00
528Tue 2 Jul 18:00
552Wed 3 Jul 18:00
576Thu 4 Jul 18:00
600Fri 5 Jul 18:00
624Sat 6 Jul 18:00
648Sun 7 Jul 18:00
672Mon 8 Jul 18:00
696Tue 9 Jul 18:00
720Wed 10 Jul 18:00
744Thu 11 Jul 18:00
768Fri 12 Jul 18:00
792Sat 13 Jul 18:00
816Sun 14 Jul 18:00
840Mon 15 Jul 18:00
864Tue 16 Jul 18:00
888Wed 17 Jul 18:00
912Thu 18 Jul 18:00
936Fri 19 Jul 18:00
960Sat 20 Jul 18:00
984Sun 21 Jul 18:00
1008Mon 22 Jul 18:00
1032Tue 23 Jul 18:00
1056Wed 24 Jul 18:00
1080Thu 25 Jul 18:00
1104Fri 26 Jul 18:00
1128Sat 27 Jul 18:00
1152Sun 28 Jul 18:00
1176Mon 29 Jul 18:00
1200Tue 30 Jul 18:00
1224Wed 31 Jul 18:00
1248Thu 1 Aug 18:00
1272Fri 2 Aug 18:00
1296Sat 3 Aug 18:00
1320Sun 4 Aug 18:00
1344Mon 5 Aug 18:00
1368Tue 6 Aug 18:00
1392Wed 7 Aug 18:00
1416Thu 8 Aug 18:00
1440Fri 9 Aug 18:00
1464Sat 10 Aug 18:00
1488Sun 11 Aug 18:00
1512Mon 12 Aug 18:00
1536Tue 13 Aug 18:00
help
Download GIF
hover
Single-variable mode
You are now in the multi variable mode. Select all the variables of interest and they will be plotted side-by-side in a grid.
You are now in the multi variable mode. Select all the variables of interest and they will be plotted side-by-side in a grid.
URL of this map