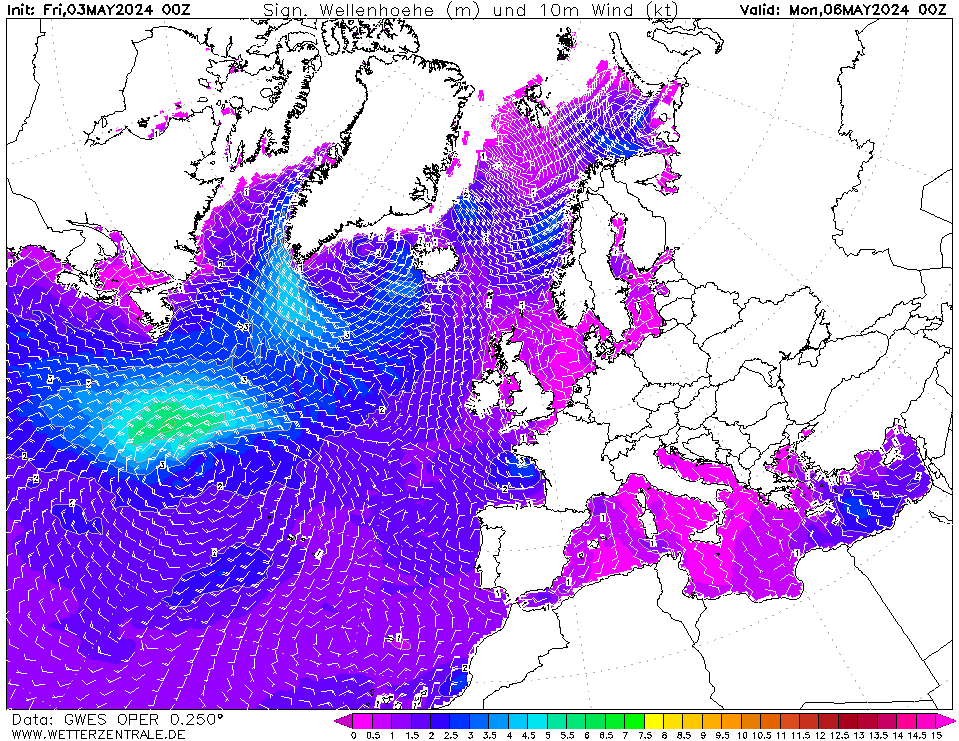
GWESCurrently selected. This page shows the wave model output from NCEP's Global Forecast System GFS (FV3). It was formerly known as GWES. The model is coupled with the GFS atmospheric model and is run 4 times daily based on 0000, 0600, 1200, and 1800 UTC start time and provides predictions to 384 hours.

Member:
OP 0Fri 10 May 00:00
3Fri 10 May 03:00
6Fri 10 May 06:00
9Fri 10 May 09:00
12Fri 10 May 12:00
15Fri 10 May 15:00
18Fri 10 May 18:00
21Fri 10 May 21:00
24Sat 11 May 00:00
27Sat 11 May 03:00
30Sat 11 May 06:00
33Sat 11 May 09:00
36Sat 11 May 12:00
39Sat 11 May 15:00
42Sat 11 May 18:00
45Sat 11 May 21:00
48Sun 12 May 00:00
51Sun 12 May 03:00
54Sun 12 May 06:00
57Sun 12 May 09:00
60Sun 12 May 12:00
63Sun 12 May 15:00
66Sun 12 May 18:00
69Sun 12 May 21:00
72Mon 13 May 00:00
75Mon 13 May 03:00
78Mon 13 May 06:00
81Mon 13 May 09:00
84Mon 13 May 12:00
87Mon 13 May 15:00
90Mon 13 May 18:00
93Mon 13 May 21:00
96Tue 14 May 00:00
99Tue 14 May 03:00
102Tue 14 May 06:00
105Tue 14 May 09:00
108Tue 14 May 12:00
111Tue 14 May 15:00
114Tue 14 May 18:00
117Tue 14 May 21:00
120Wed 15 May 00:00
123Wed 15 May 03:00
126Wed 15 May 06:00
129Wed 15 May 09:00
132Wed 15 May 12:00
135Wed 15 May 15:00
138Wed 15 May 18:00
141Wed 15 May 21:00
144Thu 16 May 00:00
147Thu 16 May 03:00
150Thu 16 May 06:00
help
Download GIF
hover
Single-variable mode
You are now in the multi variable mode. Select all the variables of interest and they will be plotted side-by-side in a grid.
You are now in the multi variable mode. Select all the variables of interest and they will be plotted side-by-side in a grid.
URL of this map