ARPEGEThe selected variable and region is available, but not for 2024-04-29, 12:00. You will switch back to the first available time step. ARPEGE is the global forecast model of the French weather service (Meteo France). It is runs with a maximum resolution of approx. 7 km in Europe and mean global grid spacing of 15 km. WZ offers forecasts up to 102 hours.
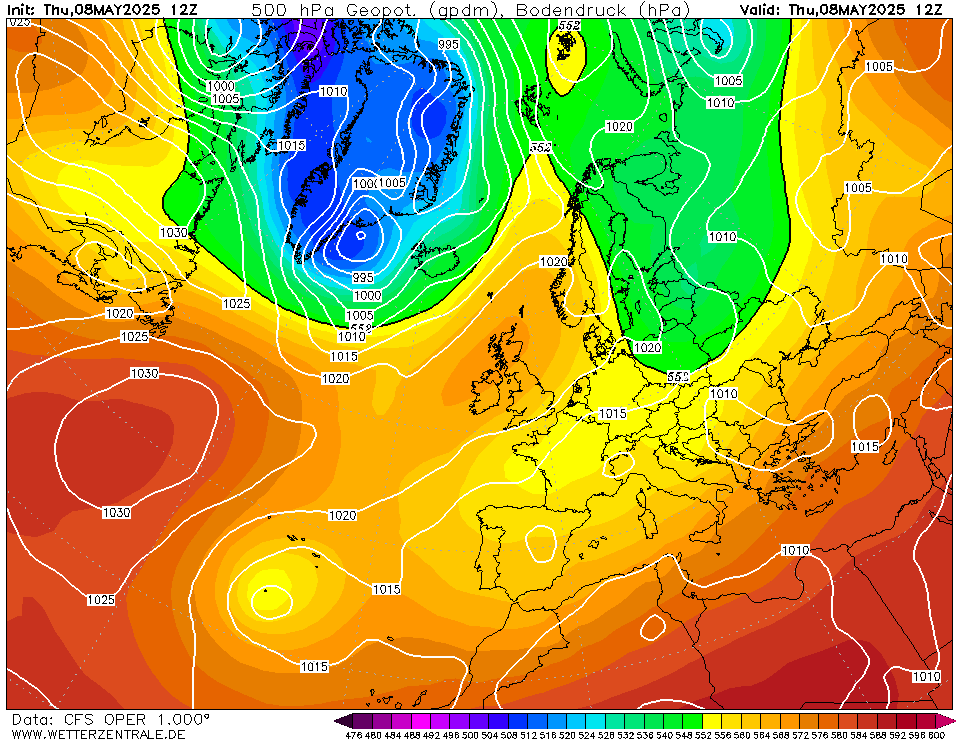
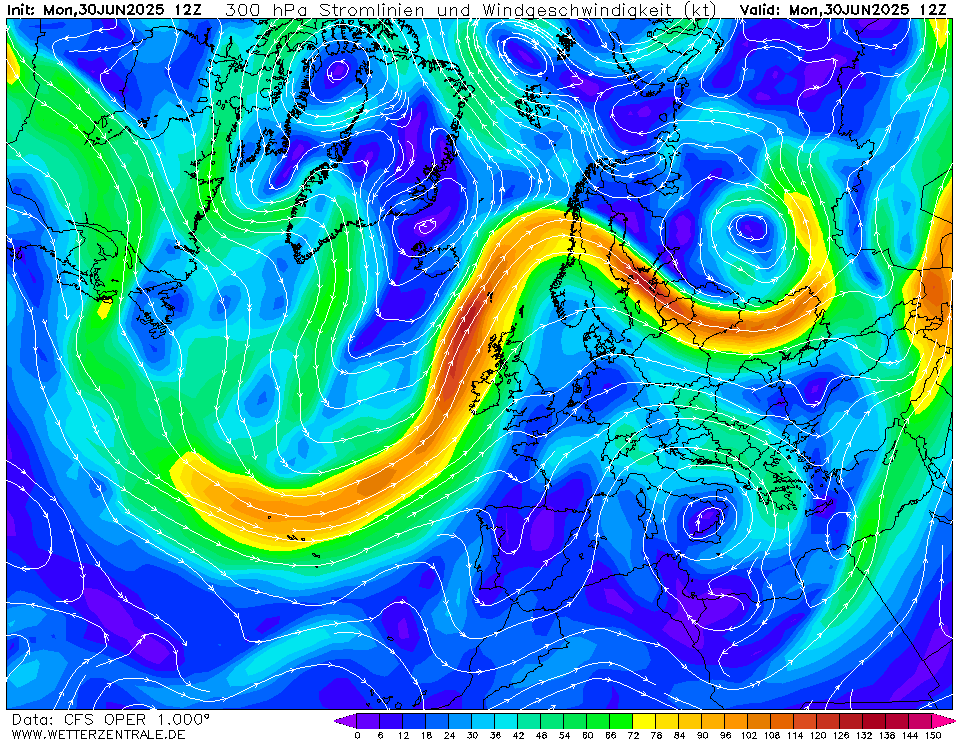
CFSCurrently selected.
ECMWFThe selected time, variable and region is available for this model. The European Centre for Medium-Range Weather Forecasts (ECMWF) creates forecasts for the upcoming 15 days and is a global leader in forecast skill. However, it offers only a small number of parameters for free. The 00Z and 12Z runs are coming in twice daily between 6 and 7 UTC and 18 and 19 UTC.
GEMThe selected time, variable and region is available for this model. GEM is the global forecast model of the Canadian weather service and computes 10 day forecasts.
GFSThe selected time, variable and region is available for this model. GFS is the global weather forecast model of the US weather service run at an internal resolution of 28 km. It offers a plethora of parameters for the next 15 days. Updated 4 times a day up to 384 hours ahead. The runs for the 0, 6, 12 and 18Z runs are usually coming in from 3:30, 9:30, 15:30 and 21:30 UTC, respectively.
ICONThe selected variable and region is available, but not for 2024-04-29, 12:00. You will switch back to the first available time step. ICON is the global weather forecast of the German weather service (DWD) with a grid spacing of approx. 13 km globally (Europe nest: 6 km). Model output is available up to 180 hours ahead for the 0Z and 12Z runs, and up to 120 hours for the 6Z and 18Z runs.
JMAThe selected time, variable and region is available for this model. The global weather forecast model of the Japanese weather service offers data up to 7 days into the future.
NAVGEMThe selected time, variable and region is available for this model. NAVGEM is a model run by the NOAA and serves the US navy with weather forecasts. The WZ maps are based on data that is available from the NCEP server with a grid spacing of 0.5 degree and is updated twice daily (7 and 19 UTC).
UKMOThe selected variable and region is available, but not for 2024-04-29, 12:00. You will switch back to the first available time step. Model output from the United Kingdom Met Office (UKMO). Maps are updated twice daily around 6:45 und 18:45 UTC. Only basic pressure maps are available and forecast data ranges from day 3 to 6.
UKMO EUThe selected variable and region is available, but not for 2024-04-29, 12:00. You will switch back to the first available time step.


Member:
OP 0Mon 29 Apr 12:00
24Tue 30 Apr 12:00
48Wed 1 May 12:00
72Thu 2 May 12:00
96Fri 3 May 12:00
120Sat 4 May 12:00
144Sun 5 May 12:00
168Mon 6 May 12:00
192Tue 7 May 12:00
216Wed 8 May 12:00
240Thu 9 May 12:00
264Fri 10 May 12:00
288Sat 11 May 12:00
312Sun 12 May 12:00
336Mon 13 May 12:00
360Tue 14 May 12:00
384Wed 15 May 12:00
408Thu 16 May 12:00
432Fri 17 May 12:00
456Sat 18 May 12:00
480Sun 19 May 12:00
504Mon 20 May 12:00
528Tue 21 May 12:00
552Wed 22 May 12:00
576Thu 23 May 12:00
600Fri 24 May 12:00
624Sat 25 May 12:00
648Sun 26 May 12:00
672Mon 27 May 12:00
696Tue 28 May 12:00
720Wed 29 May 12:00
744Thu 30 May 12:00
768Fri 31 May 12:00
792Sat 1 Jun 12:00
816Sun 2 Jun 12:00
840Mon 3 Jun 12:00
864Tue 4 Jun 12:00
888Wed 5 Jun 12:00
912Thu 6 Jun 12:00
936Fri 7 Jun 12:00
960Sat 8 Jun 12:00
984Sun 9 Jun 12:00
1008Mon 10 Jun 12:00
1032Tue 11 Jun 12:00
1056Wed 12 Jun 12:00
1080Thu 13 Jun 12:00
1104Fri 14 Jun 12:00
1128Sat 15 Jun 12:00
1152Sun 16 Jun 12:00
1176Mon 17 Jun 12:00
1200Tue 18 Jun 12:00
1224Wed 19 Jun 12:00
1248Thu 20 Jun 12:00
1272Fri 21 Jun 12:00
1296Sat 22 Jun 12:00
1320Sun 23 Jun 12:00
1344Mon 24 Jun 12:00
1368Tue 25 Jun 12:00
1392Wed 26 Jun 12:00
1416Thu 27 Jun 12:00
1440Fri 28 Jun 12:00
1464Sat 29 Jun 12:00
1488Sun 30 Jun 12:00
1512Mon 1 Jul 12:00
1536Tue 2 Jul 12:00
1560Wed 3 Jul 12:00
1584Thu 4 Jul 12:00
1608Fri 5 Jul 12:00
1632Sat 6 Jul 12:00
1656Sun 7 Jul 12:00
1680Mon 8 Jul 12:00
1704Tue 9 Jul 12:00
1728Wed 10 Jul 12:00
1752Thu 11 Jul 12:00
1776Fri 12 Jul 12:00
1800Sat 13 Jul 12:00
1824Sun 14 Jul 12:00
1848Mon 15 Jul 12:00
1872Tue 16 Jul 12:00
1896Wed 17 Jul 12:00
1920Thu 18 Jul 12:00
1944Fri 19 Jul 12:00
1968Sat 20 Jul 12:00
1992Sun 21 Jul 12:00
2016Mon 22 Jul 12:00
2040Tue 23 Jul 12:00
2064Wed 24 Jul 12:00
2088Thu 25 Jul 12:00
2112Fri 26 Jul 12:00
2136Sat 27 Jul 12:00
2160Sun 28 Jul 12:00
2184Mon 29 Jul 12:00
2208Tue 30 Jul 12:00
2232Wed 31 Jul 12:00
2256Thu 1 Aug 12:00
2280Fri 2 Aug 12:00
2304Sat 3 Aug 12:00
2328Sun 4 Aug 12:00
2352Mon 5 Aug 12:00
2376Tue 6 Aug 12:00
2400Wed 7 Aug 12:00
2424Thu 8 Aug 12:00
help
Download GIF
click
Single-variable mode
You are now in the multi variable mode. Select all the variables of interest and they will be plotted side-by-side in a grid.
You are now in the multi variable mode. Select all the variables of interest and they will be plotted side-by-side in a grid.
URL of this map