ARPEGEThe selected time, variable and region is available for this model. ARPEGE is the global forecast model of the French weather service (Meteo France). It is runs with a maximum resolution of approx. 7 km in Europe and mean global grid spacing of 15 km. WZ offers forecasts up to 102 hours.
CFSThe selected time, variable and region is available for this model.
GEMThe selected time, variable and region is available for this model. GEM is the global forecast model of the Canadian weather service and computes 10 day forecasts.
GFSThe selected time, variable and region is available for this model. GFS is the global weather forecast model of the US weather service run at an internal resolution of 28 km. It offers a plethora of parameters for the next 15 days. Updated 4 times a day up to 384 hours ahead. The runs for the 0, 6, 12 and 18Z runs are usually coming in from 3:30, 9:30, 15:30 and 21:30 UTC, respectively.
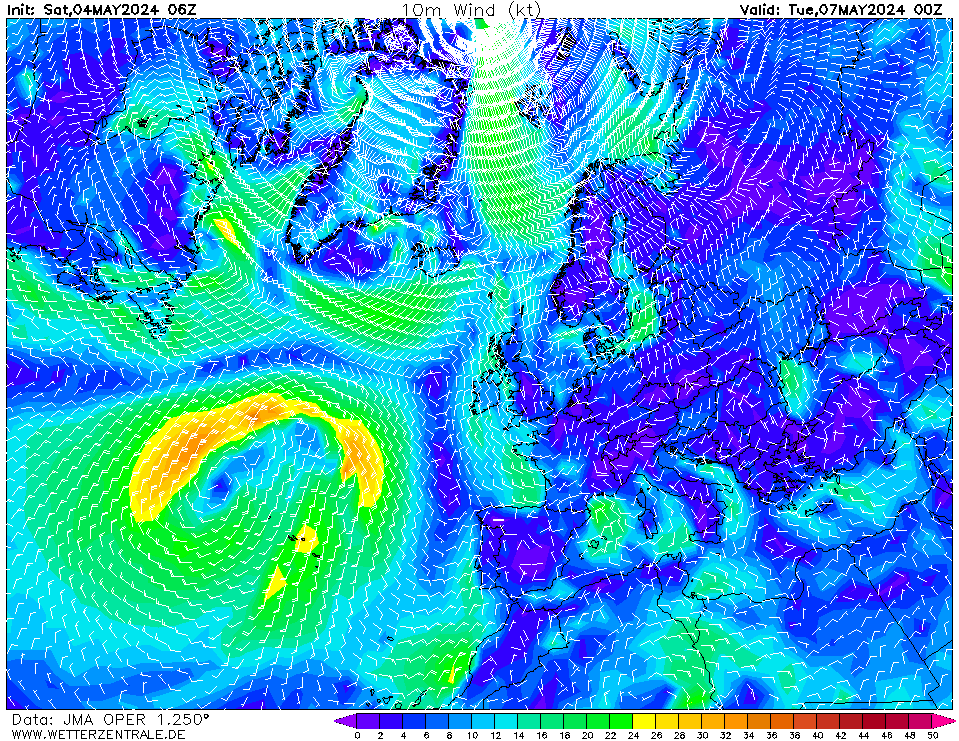
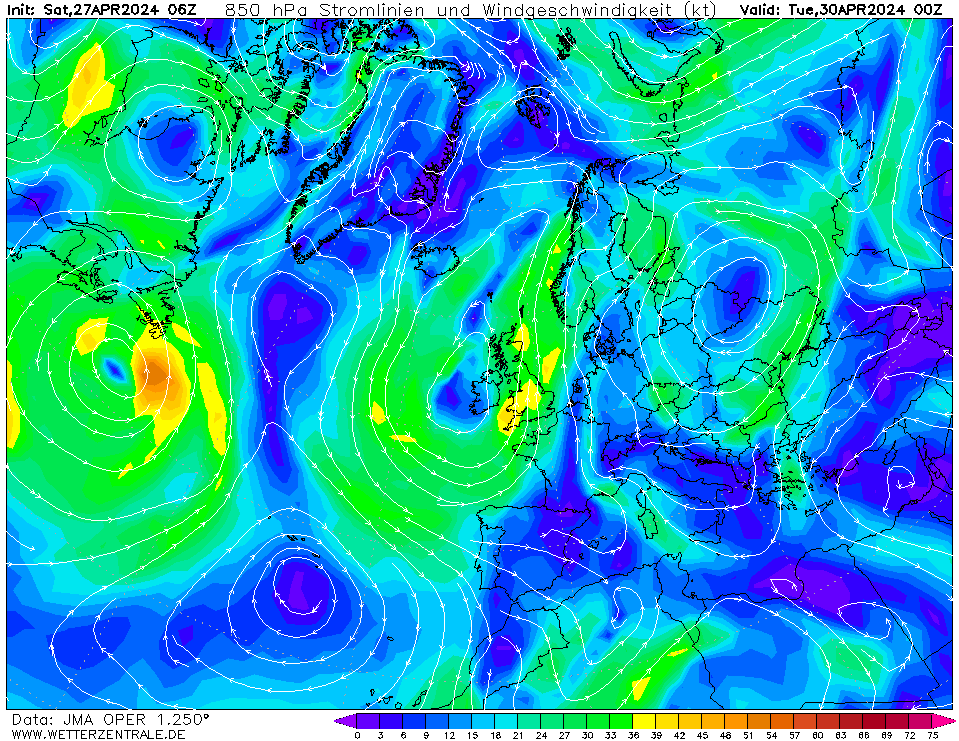
JMACurrently selected. The global weather forecast model of the Japanese weather service offers data up to 7 days into the future.
NAVGEMThe selected time, variable and region is available for this model. NAVGEM is a model run by the NOAA and serves the US navy with weather forecasts. The WZ maps are based on data that is available from the NCEP server with a grid spacing of 0.5 degree and is updated twice daily (7 and 19 UTC).
UKMO EUThe selected variable and region is available, but not for 2024-06-14, 00:00. You will switch back to the first available time step.


Member:
OP 0Tue 11 Jun 06:00
6Tue 11 Jun 12:00
12Tue 11 Jun 18:00
18Wed 12 Jun 00:00
24Wed 12 Jun 06:00
30Wed 12 Jun 12:00
36Wed 12 Jun 18:00
42Thu 13 Jun 00:00
48Thu 13 Jun 06:00
54Thu 13 Jun 12:00
60Thu 13 Jun 18:00
66Fri 14 Jun 00:00
72Fri 14 Jun 06:00
78Fri 14 Jun 12:00
84Fri 14 Jun 18:00
90Sat 15 Jun 00:00
96Sat 15 Jun 06:00
102Sat 15 Jun 12:00
108Sat 15 Jun 18:00
114Sun 16 Jun 00:00
120Sun 16 Jun 06:00
126Sun 16 Jun 12:00
132Sun 16 Jun 18:00
help
Download GIF
hover
Single-variable mode
You are now in the multi variable mode. Select all the variables of interest and they will be plotted side-by-side in a grid.
You are now in the multi variable mode. Select all the variables of interest and they will be plotted side-by-side in a grid.
URL of this map