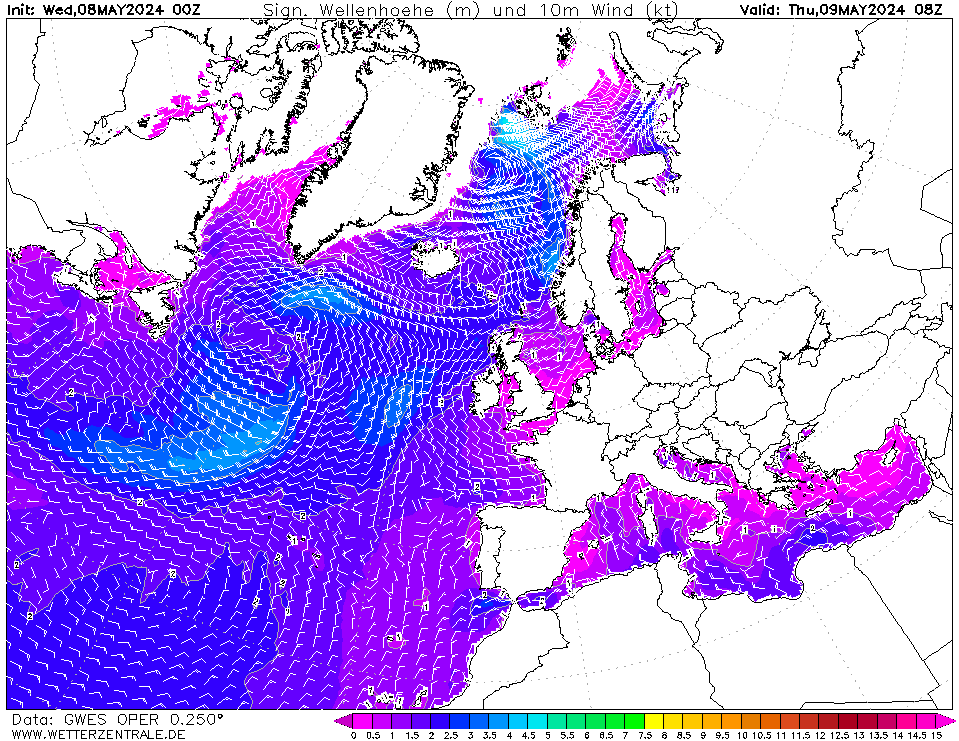
GWESCurrently selected. This page shows the wave model output from NCEP's Global Forecast System GFS (FV3). It was formerly known as GWES. The model is coupled with the GFS atmospheric model and is run 4 times daily based on 0000, 0600, 1200, and 1800 UTC start time and provides predictions to 384 hours.

Member:
OP 0Mon 27 May 00:00
1Mon 27 May 01:00
2Mon 27 May 02:00
3Mon 27 May 03:00
4Mon 27 May 04:00
5Mon 27 May 05:00
6Mon 27 May 06:00
7Mon 27 May 07:00
8Mon 27 May 08:00
9Mon 27 May 09:00
10Mon 27 May 10:00
11Mon 27 May 11:00
12Mon 27 May 12:00
13Mon 27 May 13:00
14Mon 27 May 14:00
15Mon 27 May 15:00
16Mon 27 May 16:00
17Mon 27 May 17:00
18Mon 27 May 18:00
19Mon 27 May 19:00
20Mon 27 May 20:00
21Mon 27 May 21:00
22Mon 27 May 22:00
23Mon 27 May 23:00
24Tue 28 May 00:00
25Tue 28 May 01:00
26Tue 28 May 02:00
27Tue 28 May 03:00
28Tue 28 May 04:00
29Tue 28 May 05:00
30Tue 28 May 06:00
31Tue 28 May 07:00
32Tue 28 May 08:00
33Tue 28 May 09:00
34Tue 28 May 10:00
35Tue 28 May 11:00
36Tue 28 May 12:00
37Tue 28 May 13:00
38Tue 28 May 14:00
39Tue 28 May 15:00
40Tue 28 May 16:00
41Tue 28 May 17:00
42Tue 28 May 18:00
43Tue 28 May 19:00
44Tue 28 May 20:00
45Tue 28 May 21:00
help
Download GIF
hover
Single-variable mode
You are now in the multi variable mode. Select all the variables of interest and they will be plotted side-by-side in a grid.
You are now in the multi variable mode. Select all the variables of interest and they will be plotted side-by-side in a grid.
URL of this map