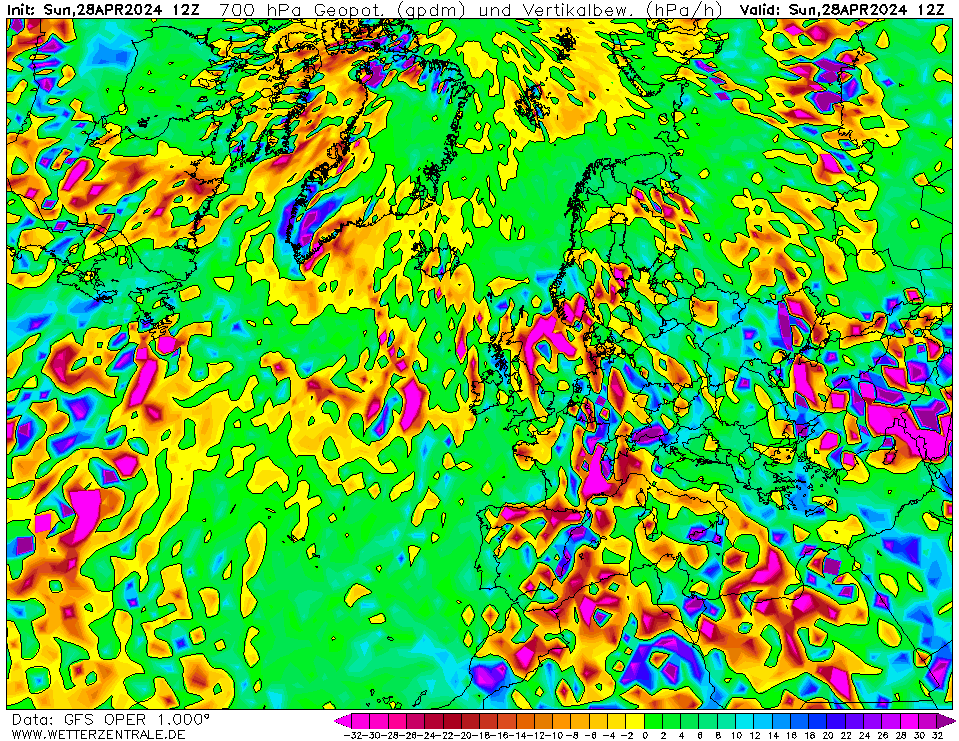
GFSCurrently selected. GFS is the global weather forecast model of the US weather service run at an internal resolution of 28 km. It offers a plethora of parameters for the next 15 days. Updated 4 times a day up to 384 hours ahead. The runs for the 0, 6, 12 and 18Z runs are usually coming in from 3:30, 9:30, 15:30 and 21:30 UTC, respectively.
NAVGEMThe selected variable and region is available, but not for 2024-06-07, 15:00. You will switch back to the first available time step. NAVGEM is a model run by the NOAA and serves the US navy with weather forecasts. The WZ maps are based on data that is available from the NCEP server with a grid spacing of 0.5 degree and is updated twice daily (7 and 19 UTC).


0Sun 26 May 12:00
6Sun 26 May 18:00
12Mon 27 May 00:00
18Mon 27 May 06:00
24Mon 27 May 12:00
30Mon 27 May 18:00
36Tue 28 May 00:00
42Tue 28 May 06:00
48Tue 28 May 12:00
54Tue 28 May 18:00
60Wed 29 May 00:00
66Wed 29 May 06:00
72Wed 29 May 12:00
78Wed 29 May 18:00
84Thu 30 May 00:00
90Thu 30 May 06:00
96Thu 30 May 12:00
102Thu 30 May 18:00
108Fri 31 May 00:00
114Fri 31 May 06:00
120Fri 31 May 12:00
126Fri 31 May 18:00
132Sat 1 Jun 00:00
138Sat 1 Jun 06:00
144Sat 1 Jun 12:00
150Sat 1 Jun 18:00
156Sun 2 Jun 00:00
162Sun 2 Jun 06:00
168Sun 2 Jun 12:00
174Sun 2 Jun 18:00
180Mon 3 Jun 00:00
186Mon 3 Jun 06:00
192Mon 3 Jun 12:00
198Mon 3 Jun 18:00
204Tue 4 Jun 00:00
210Tue 4 Jun 06:00
216Tue 4 Jun 12:00
222Tue 4 Jun 18:00
228Wed 5 Jun 00:00
234Wed 5 Jun 06:00
240Wed 5 Jun 12:00
246Wed 5 Jun 18:00
252Thu 6 Jun 00:00
258Thu 6 Jun 06:00
264Thu 6 Jun 12:00
270Thu 6 Jun 18:00
276Fri 7 Jun 00:00
282Fri 7 Jun 06:00
288Fri 7 Jun 12:00
294Fri 7 Jun 18:00
300Sat 8 Jun 00:00
306Sat 8 Jun 06:00
312Sat 8 Jun 12:00
318Sat 8 Jun 18:00
324Sun 9 Jun 00:00
330Sun 9 Jun 06:00
336Sun 9 Jun 12:00
342Sun 9 Jun 18:00
348Mon 10 Jun 00:00
354Mon 10 Jun 06:00
360Mon 10 Jun 12:00
366Mon 10 Jun 18:00
372Tue 11 Jun 00:00
378Tue 11 Jun 06:00
384Tue 11 Jun 12:00
help
Download GIF
hover
Single-variable mode
You are now in the multi variable mode. Select all the variables of interest and they will be plotted side-by-side in a grid.
You are now in the multi variable mode. Select all the variables of interest and they will be plotted side-by-side in a grid.
URL of this map